Props and pieces (and a meme)

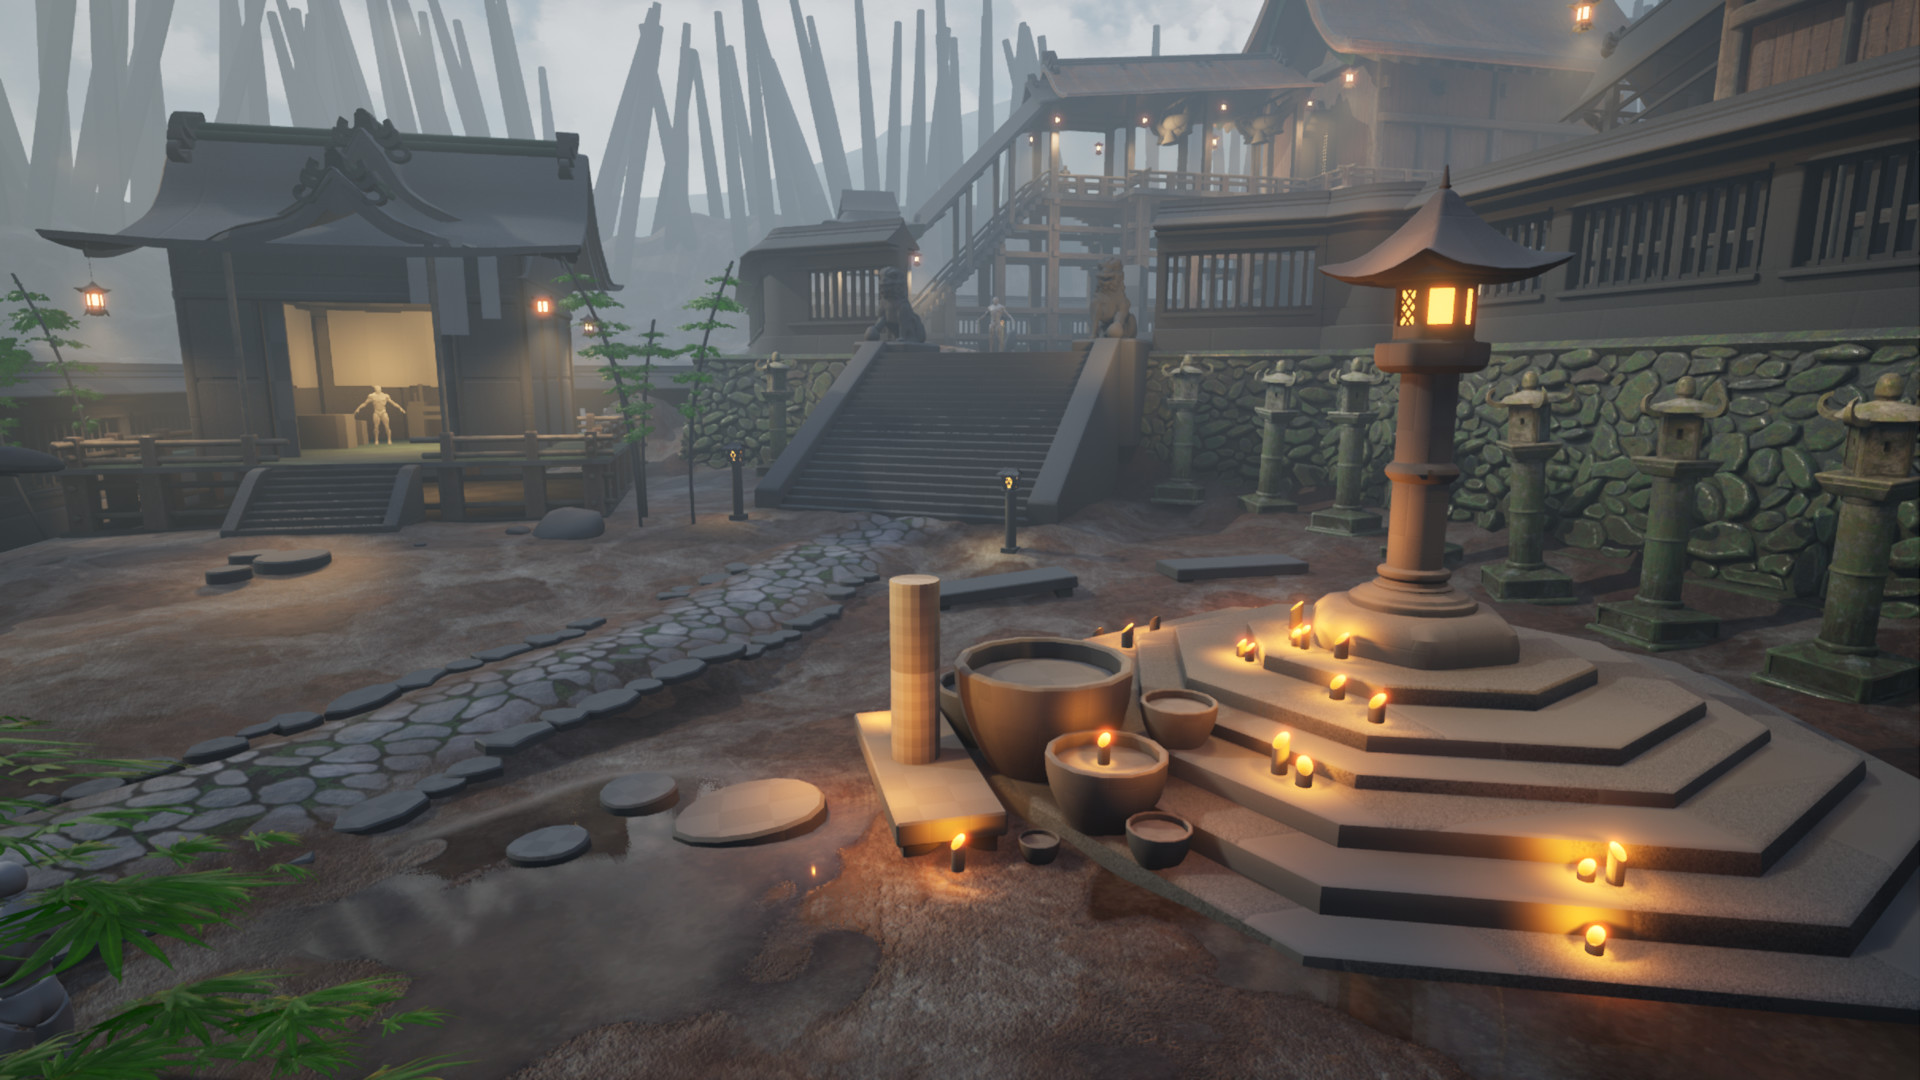
Finalized modelling and texturing 2 modular pieces and a prop. I also did some work on the landscape actor. The textures on the land are a placeholder and the colors maybe a bit too red, but I am really happy with how my Landscape Blending Material works. Created it in a such a way that its very easy to include a new texture and also parameters for roughness and tiling amount are exposed.
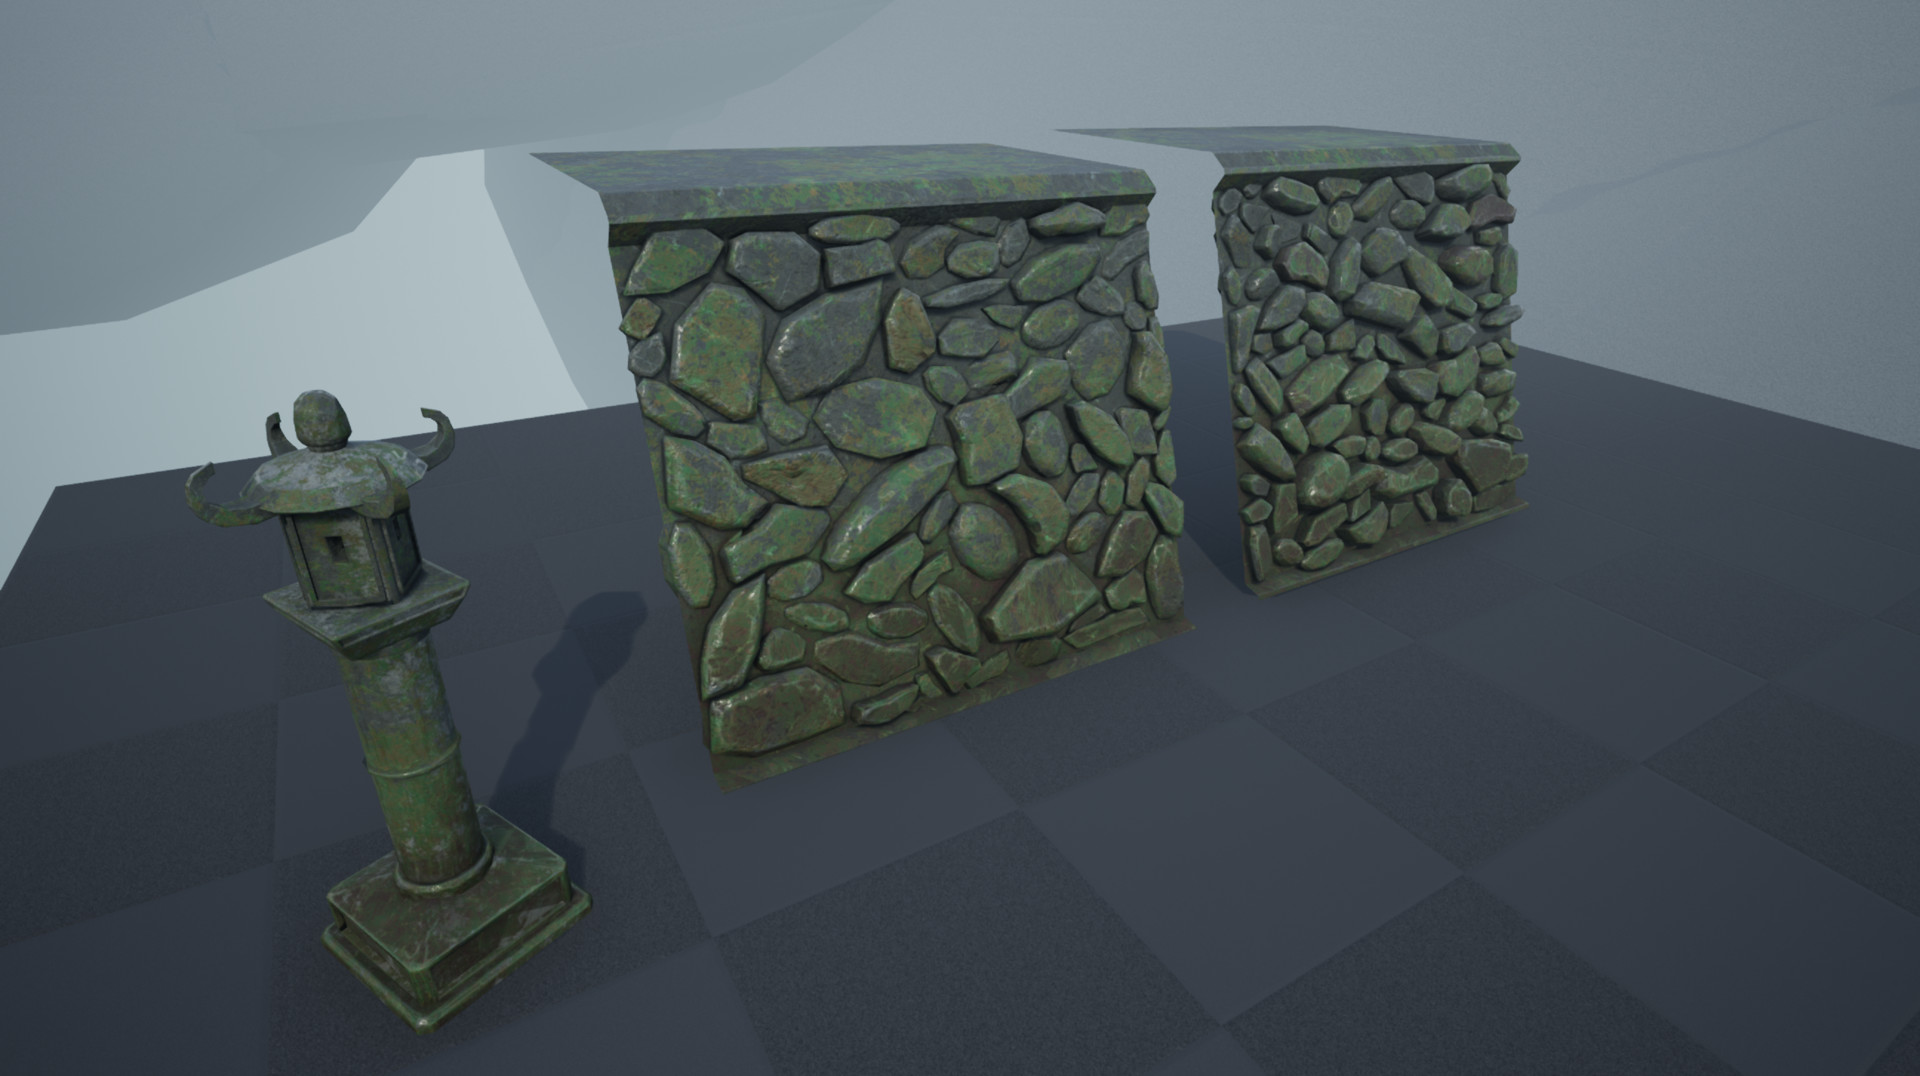
Here are the modular bits:

I decided to go a bit heavier on geometry, because my main shots include those pieces repeated so much that they take quite a bit of screen space. Instead of tileable texture, I sculpted the two pieces, baked and then used my stone material I showed a few posts ago. Exposing HSV of it proved very useful as I was able to give it this green look that way. I might make the surface of the stones more light so they appear a bit more grey later on.
Meme

A meme to illustrate my thoughts (image not mine, its a meme after all). In an ideal world for an ideal game, I would have to do lots of optimizing with a few LODs for that modular prop. But as its not gonna get repeated that much and as we are dealing with specific angle shots, I can save time and not do it. That’s the main reason I decided to go with geometry instead of Substance Designer made texture, for example.
Hope you like what you see, feel free to drop a comment. Good night from me!
Commentary from 2023 (polycount)
Back when I was making these stone, inclined beds above, I distinctively remember being incredibly worried that what I am creating is crazy amounts of high-poly. That whoever sees my work will see right past me and understand how inexperienced I am because of the high triangle count.
I could have not been further from the truth (even with that second part above, about being inexperienced, being true back then).
I can’t quote you exact numbers but if memory serves me well, the stones wall prop was sitting around 1,800 - 2,000 tris.
That is absolutely acceptable. It is acceptable as a prop tris count now in 2023 and it was back in 2018 too. Not much has changed in the span of those years (well, if we ignore Nanite and the possibilities of UE5 right now, of course…).
But the topic opens up a perfect opportunity to talk about triangle counts and preconceptions (and misconceptions) that fly around in students heads (like mine back then!).
I will try to keep it short and to the point, so my advise now would be: do not take polycount advise from people who don’t know what draw calls or LODs are. Do not take polycount advise from people who will not ask the questions of what the intended game style is and what the main gameplay camera implementation is.
Truth is you can get away with really high poly budgets for a single object. You can do that because you can then implement a few LODs that load much smaller polycount copies with the player going further away from the object.
In a lot of student projects not only are there no LODs in sight, especially in projects that are FPS and would benefit immensely from it, but in most of them the draw calls are an absolute mess as well. As such the performance of their game prototype is dragged down by mostly that: over the roof high amount of draw calls and crazy amount of overlapping dynamic lights.
Next when inevitably the question pops up, in their prototype, of “What is wrong with the performance?” and “How do we regain back good performance?” lots and lots of inexperienced tutors will take a look at the screen and in a deep, pondering facial expression go: “Hmmmm, yes… your props are way too highpoly and the amount of tris drawn on the screen are too high.”. Wrong.
Analyze your draw calls first, look at your lights, consider some LODs and only then go cutting big percentages of polycount from objects that are most likely already lowpoly and optimized enough.
In Unreal you can open the CMD (using the ¬ key on your keyboard) and type “stat scenerendering”. A menu will pop up that lists your amount of draw calls. Consider looking into ways to reduce them if they are high.
Another very useful command is “ProfileGPU” that will open you up a much more detailed screen where you can see a breakdown of how much resources go where in ms.
Reading all of those is crucial for understanding better what the culprit of your performance is.
If you want to read more about draw calls (though not a technical guide by any means) you can do so over at blog entry 6 of this project where in my 2023 update I talk about it.
