
Intro
There are many reason as to why a game project or a prototype could have low performance. In order to find the source of the trouble, one needs to profile both their CPU and their GPU intensive processes. Different things we do in an engine, mechanics or visuals that we implement can end up on the CPU or on the GPU. We could have a perfect performance on one of those, but if the other one is lacking, we will be negatively bound to it. That is what we mean when we try to analyze whether we are CPU-bound or GPU-bound in a game.
Over the years I’ve seen many student’s projects that are not supposed to be mechanically or visually complex, but simple and elegant on purpose. They are just blockouts of 3D spaces that are a “Level Design” exercise more than anything else. In their project, though, the student will still struggle with performance.
It’s a mostly a sketch, level design blockout, yet the FPS is low. Why?
Culprits
There are many reasons that could cause the issues. One would need to in detail profile their project in order to find the specifics.
When it comes to student works though, there are some culprits that I often see repeated again and again. As such we could make an educated guess and say that, as a student, the project you are working in right now, might have exactly one of those issues.
Those four main reasons are:
- blocking out using BSP Brushes;
- blocking out by making blueprint actors;
- creating a loot item that has an animation on the CPU;
- using lots of overlapping lights.
The first three are actually the same issue, disguised differently. That is the problem of “draw calls”. We will look into that next.
Game Engines
Engine:
The examples we show in this blog are mostly in UE5. If we were doing things in UE4 the situation would be nearly identical. Nanite in UE5 handles draw calls better than UE4 but most of the explanations I mention as culprits for low performance cannot be fully alleviated by Nanite. As such the issue persists.
Unity:
In my student days, I didn't know about a lot of these tech issues that I'm about to describe here. I learned about the culprits and how to resolve them back in my first industry job. It was an indie game dev studio. In there, I actually worked in Unity. Even though Unity can be quite different from UE5 in some aspects, lots of the fundamentals are the same. If you are learning and working with Unity right now, you would still benefit from reading this blog post.
Issues Explored:
Draw Calls
The biggest issue that I most often find in students projects is mismanagement of draw calls. This one is so prevalent that I think it can be found often in indie projects out there too. Those are projects that are done by experienced people who might not have found good ways to manage their draw calls yet either.
Draw calls is a topic that is not very often discussed at universities and schools either. As such it creeps as a mistake in so many game prototypes (and some finished, released games too).
Draw call:
A draw call is a request going through the CPU, that will inform the GPU what object to render and how to render it. The request comes with a bundle of information like position, scale, material IDs, material usage and more. It can be for a single object or a batch of objects.
In larger game companies, knowledge and experience flows freely, and as such when it comes to their games there will often be people, or custom tools, that will directly optimize and look at the draw calls footprint through the different stages of the project.
The way most engines work is through common and easy tactics that when applied will have your many objects on the screen end up in batches of draw calls. That way the scene gets optimized and the number of draw calls is controlled.
The goal is to always keep our draw calls amount low.
But there are some things you might do that will hardly ever batch. Those things will skyrocket your draw calls amount:
BSP Brushes
One case study for an easy way to skyrocket your draw calls (thats very bad) in both UE5 and UE4 is through the usage of BSP Brushes.
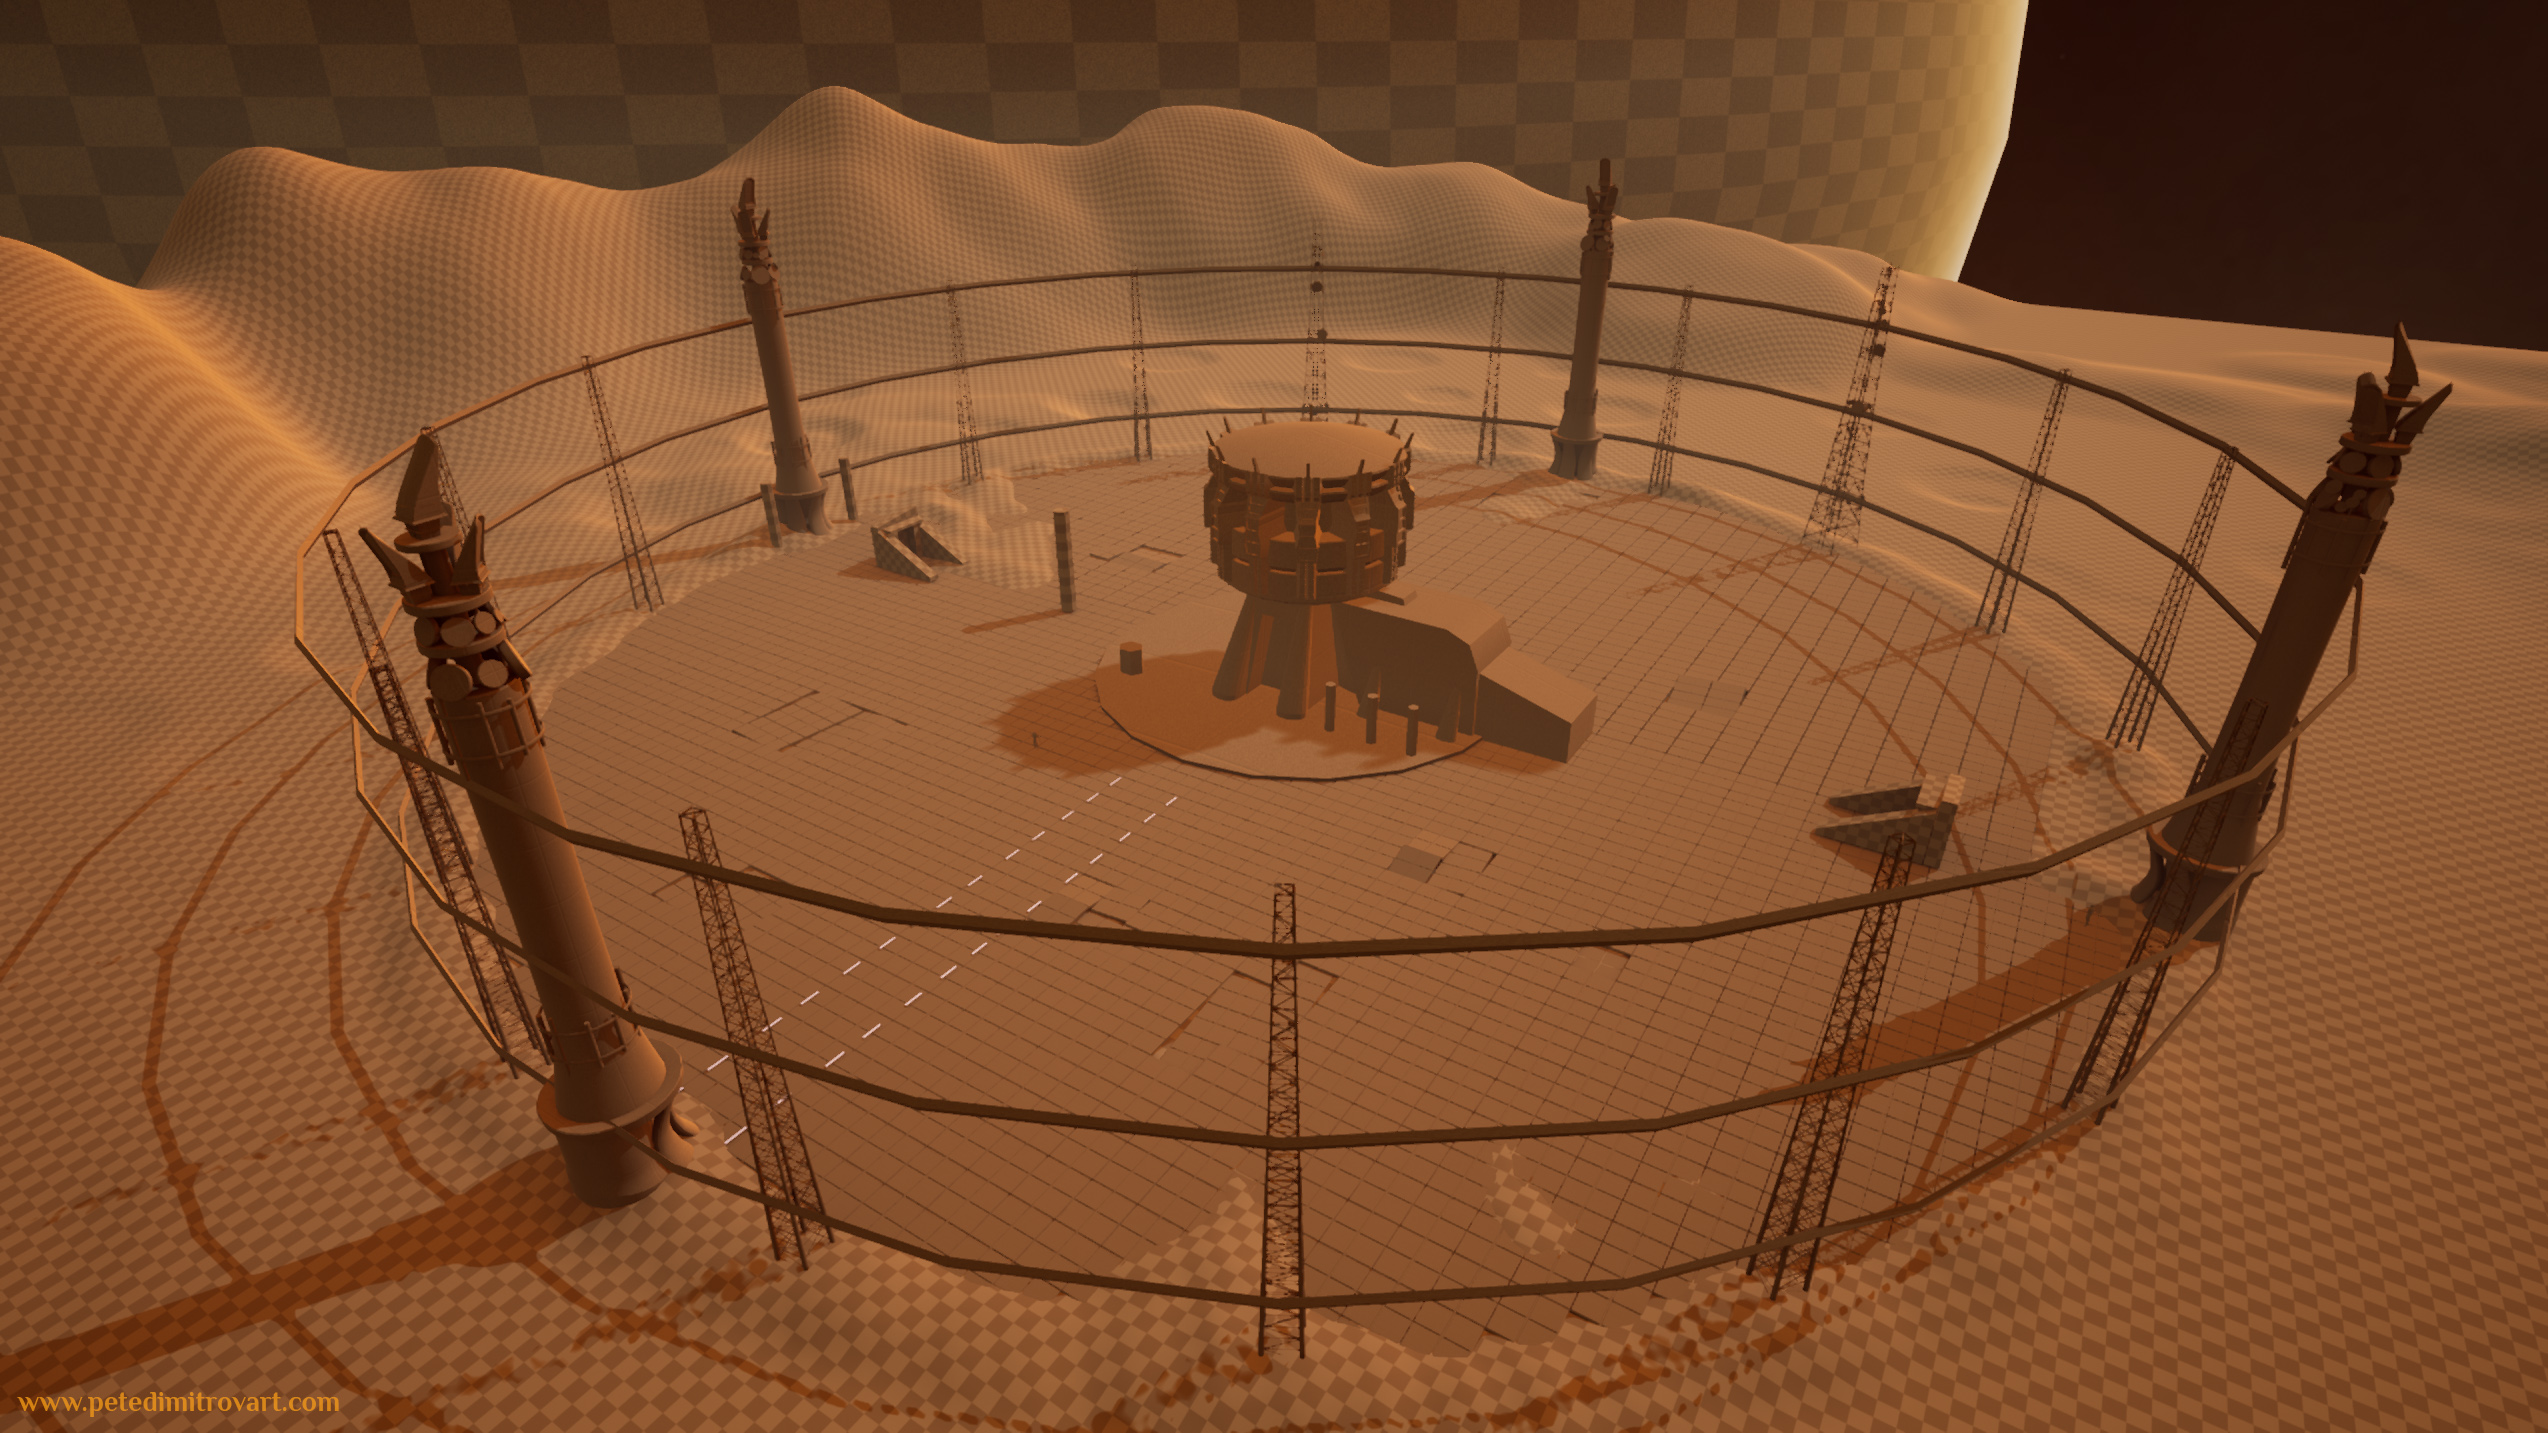
Here are a few example screenshots from my environment project “The Animal Shrine”, 2018.
In the image above, my project is in early blockout. I love doing my measurements and shapes exploration for the different buildings through BSP brushes. But there is a giant drawback to using BSP brushes. If I am not careful and aware of it, I could easily create a larger blockout that then has incredibly poor performance.
Imagine the things seen above, but suddenly duplicated many times and blocking out a level that is few kilometers wider, instead of the smaller section of level seen above. The poor performance created by the BSPs will then even be exponentially higher.
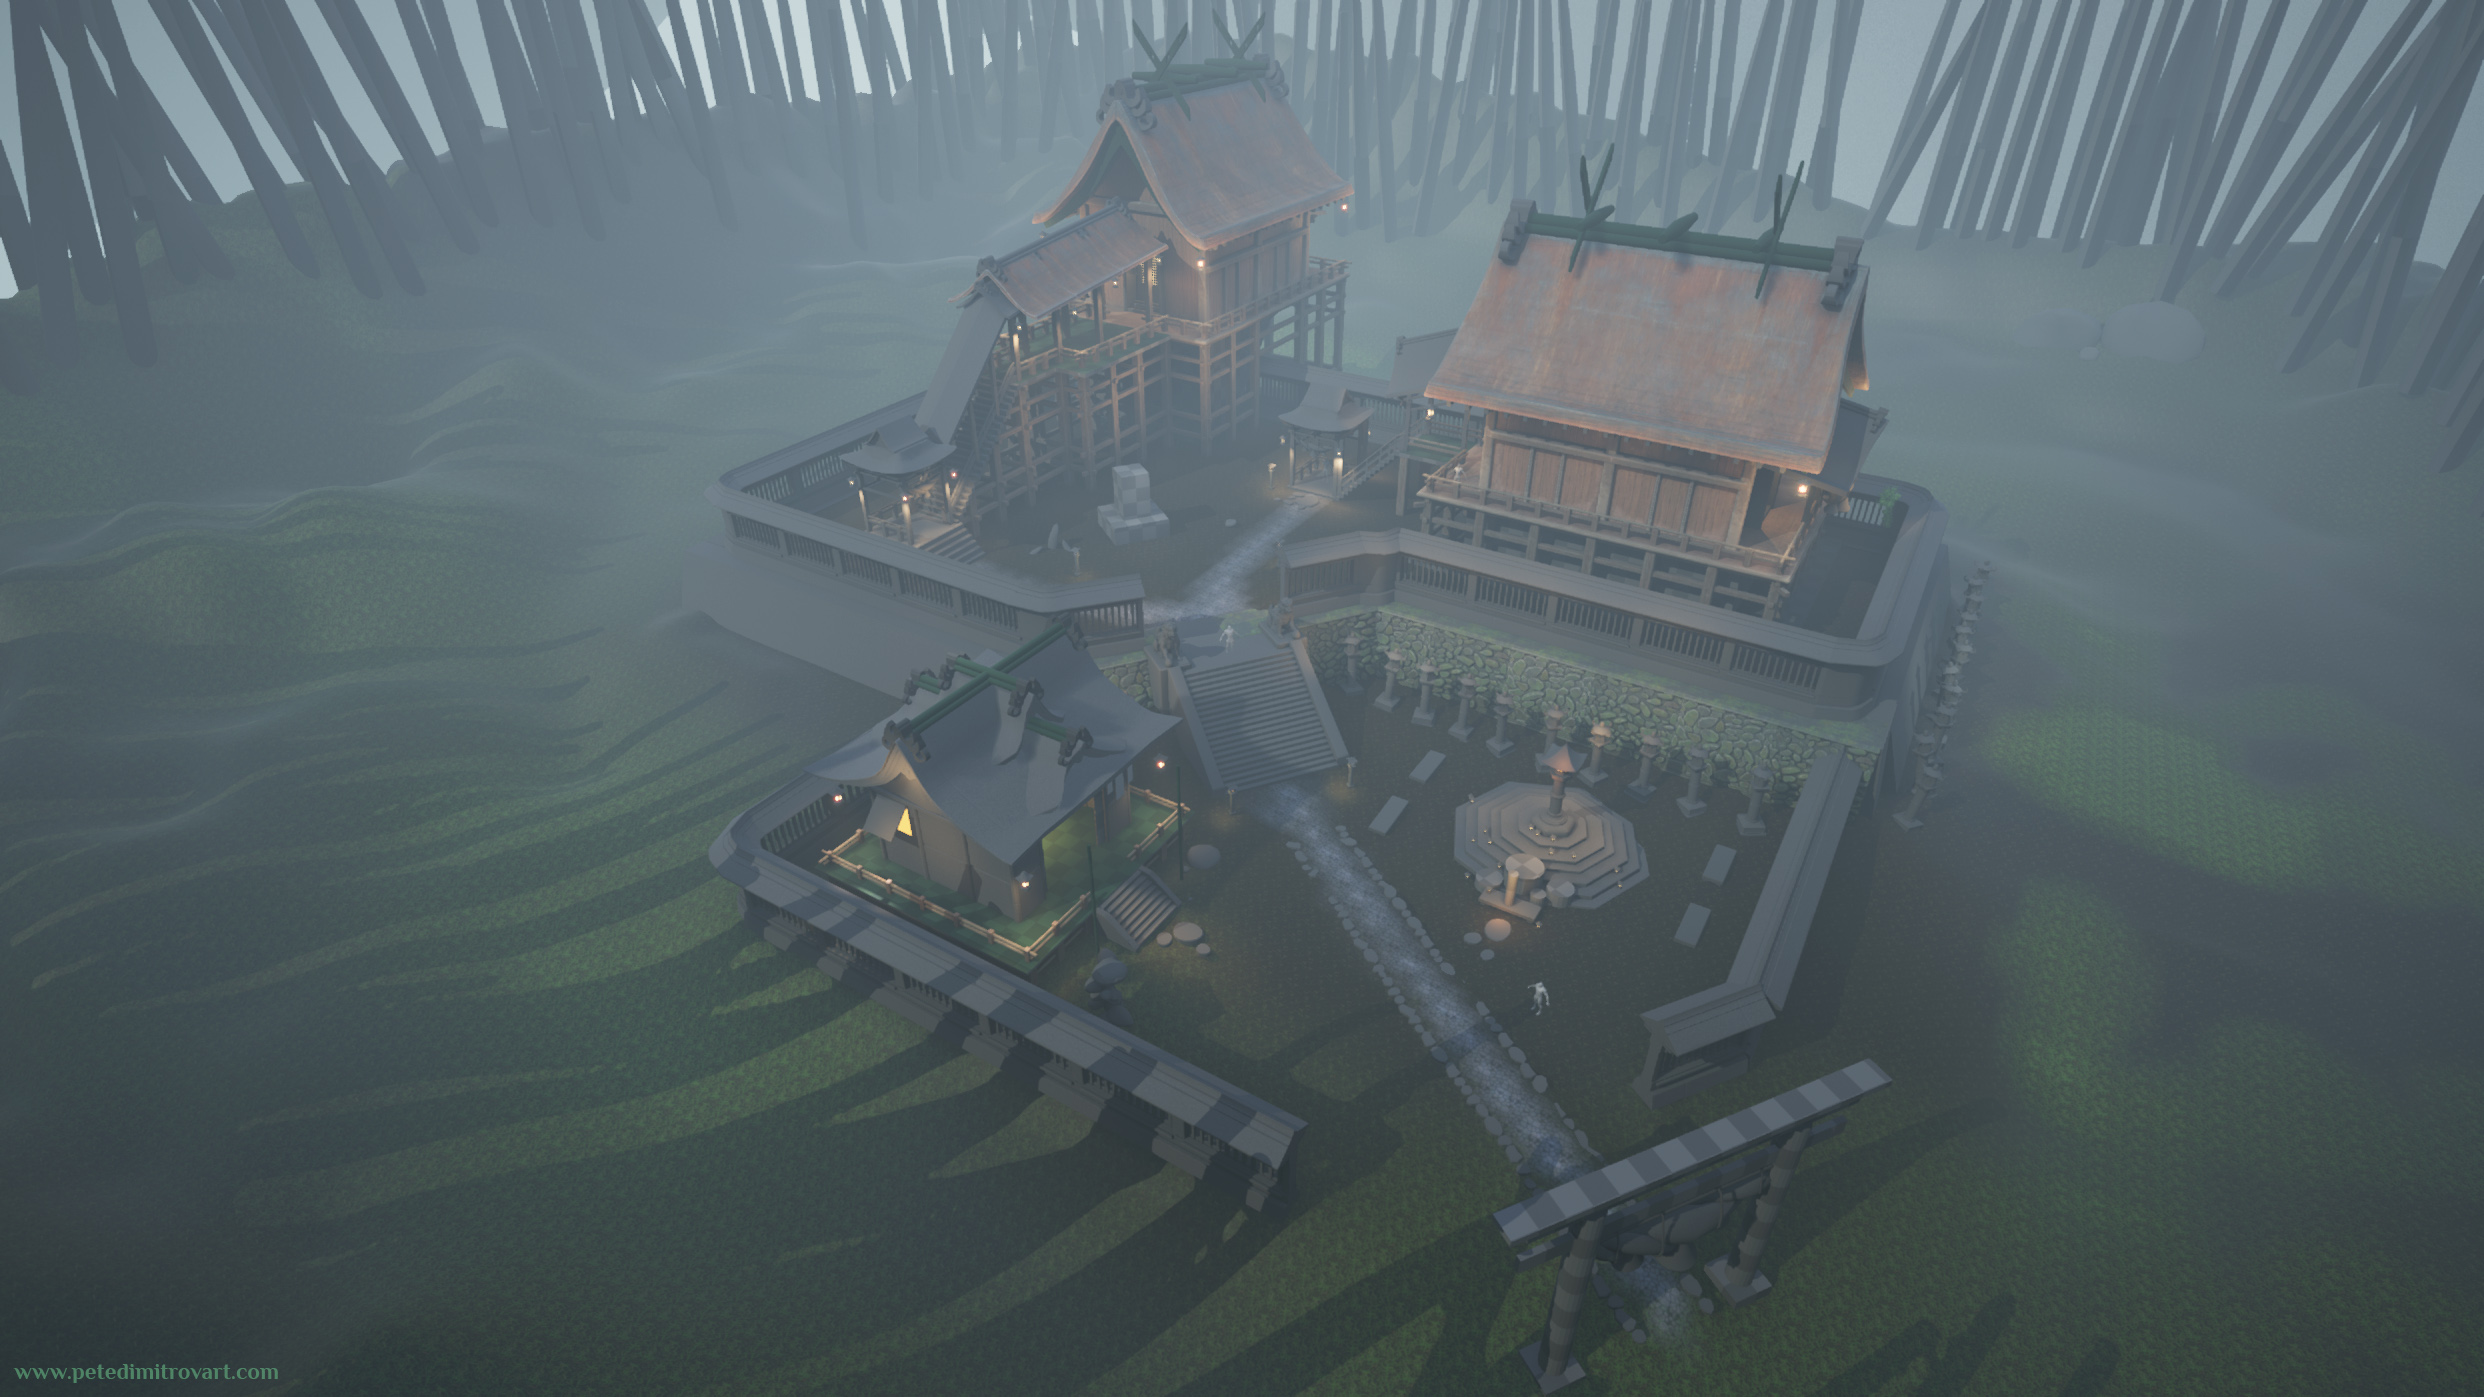
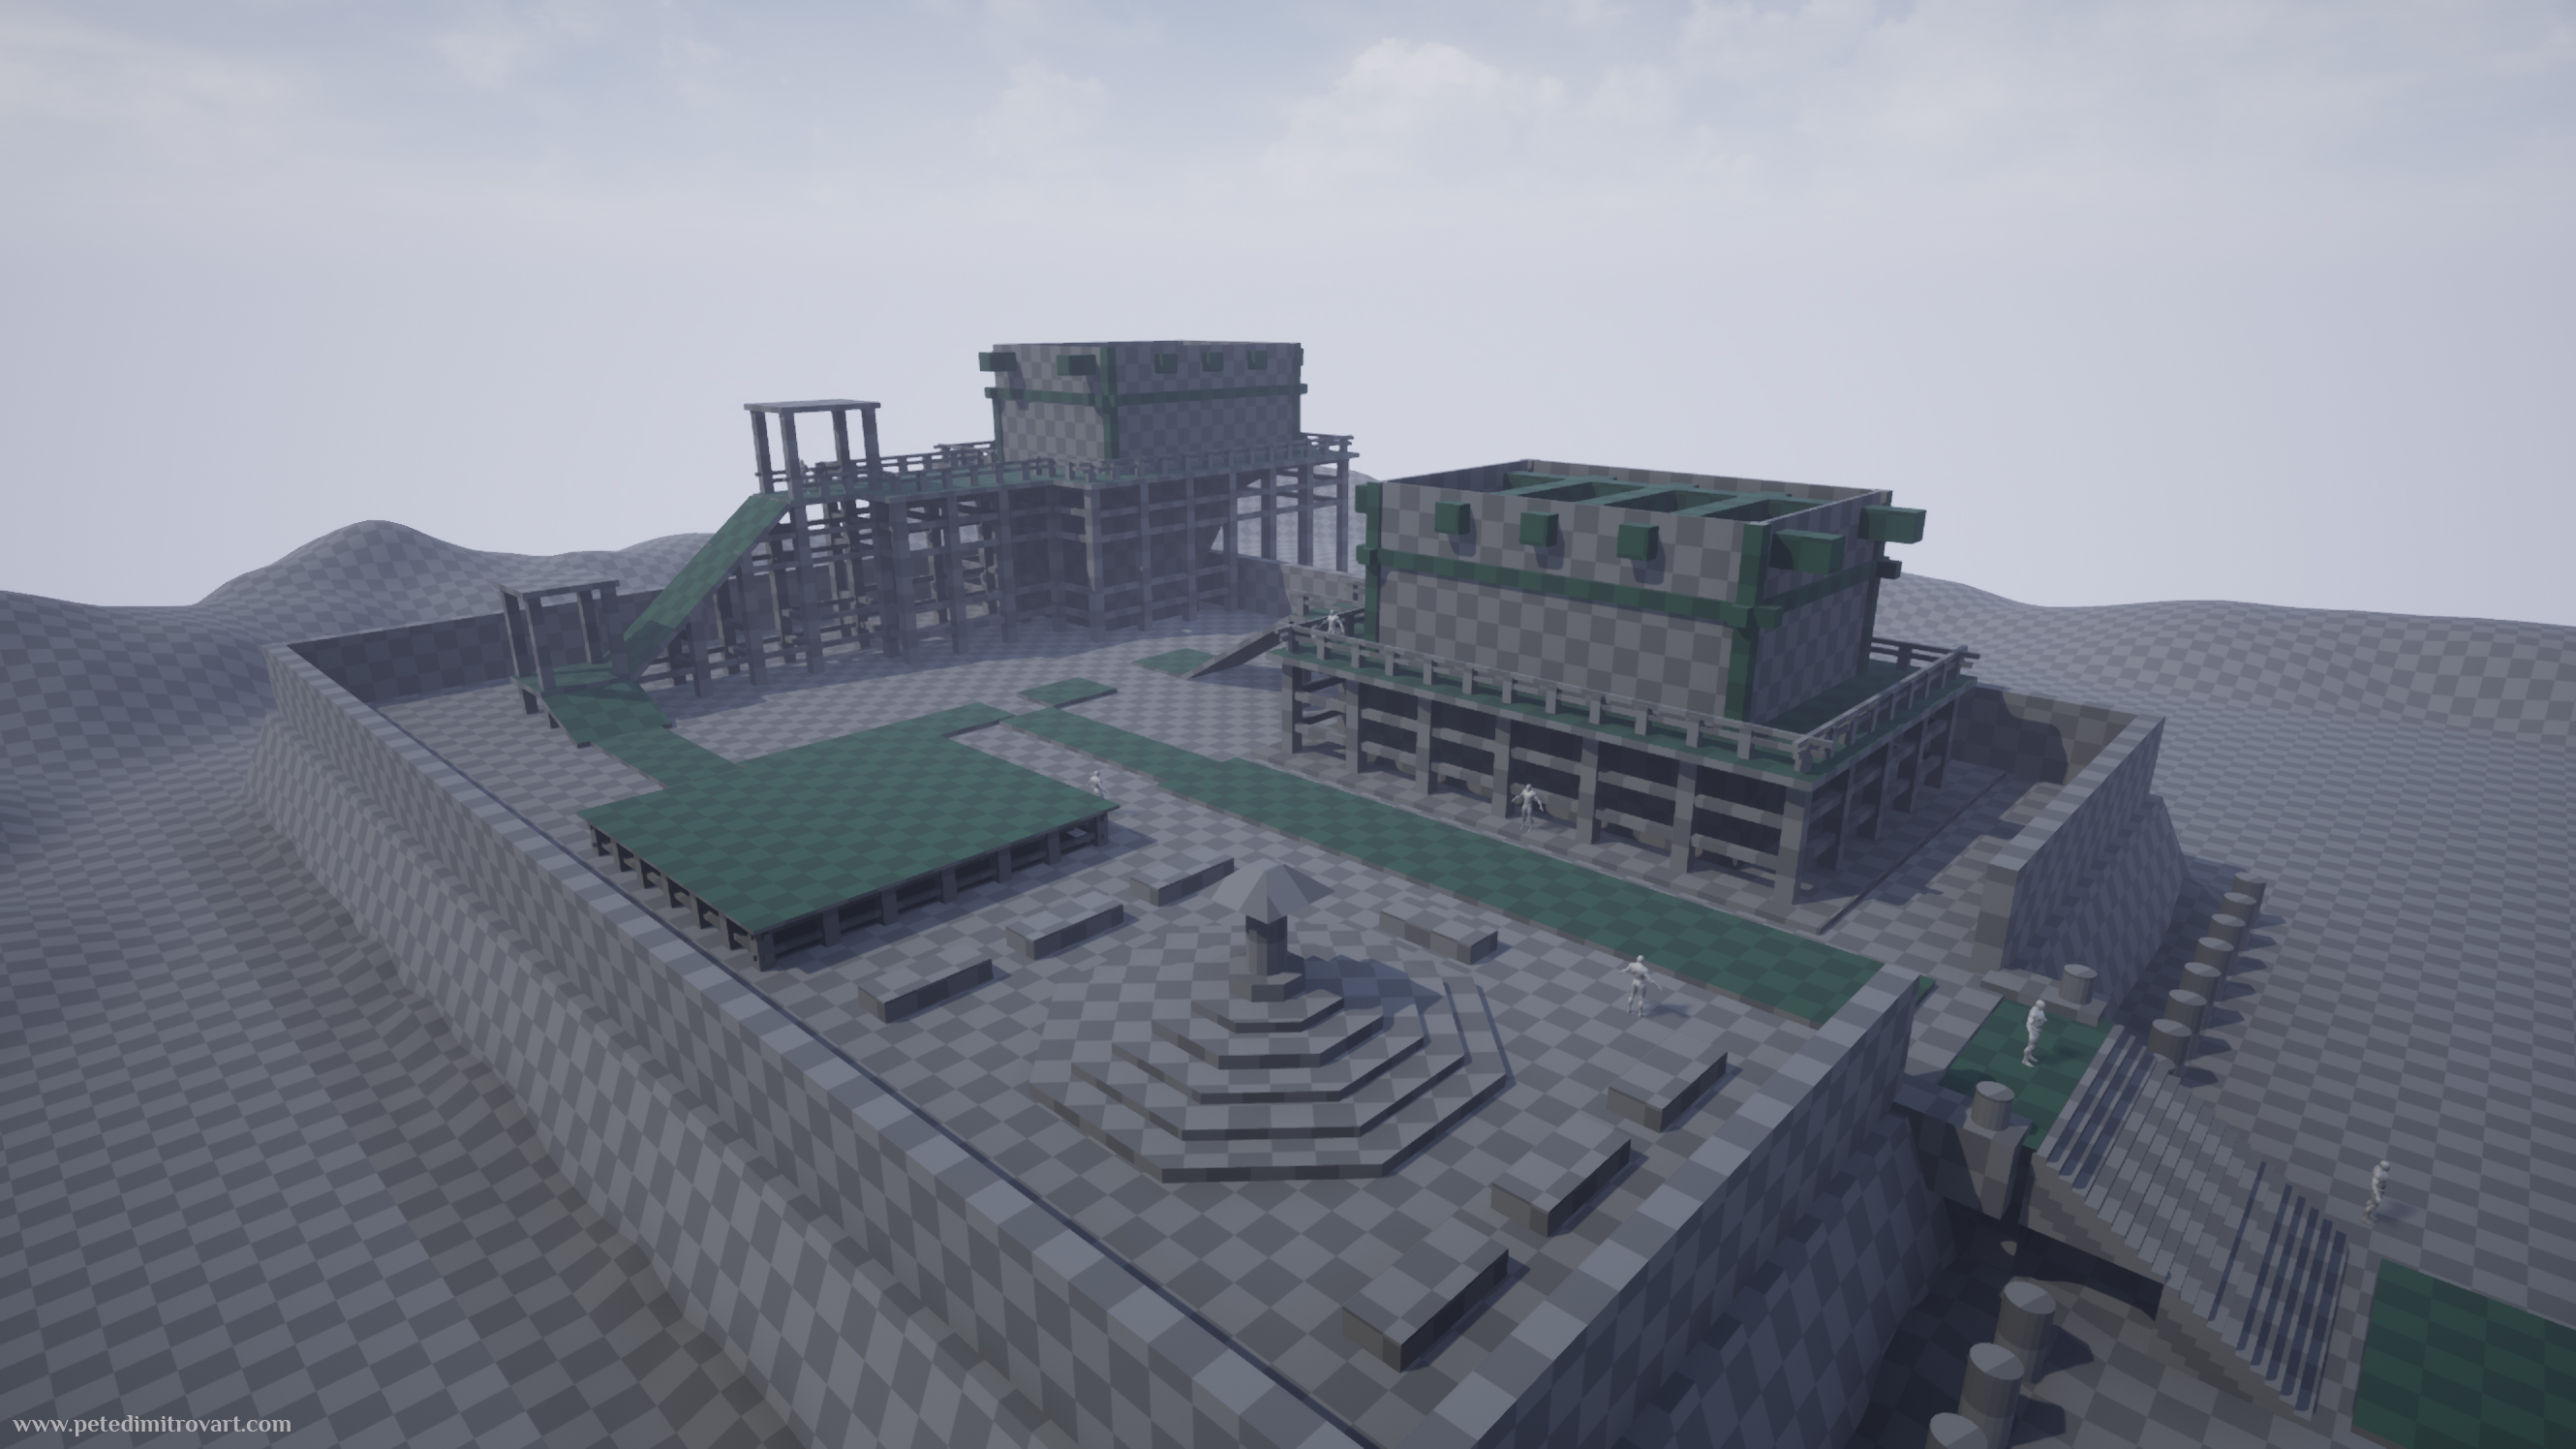
In the image above, we see a later dev stage where I have already replaced all of my BSP brushes for actual static geometry, created in Blender (or Maya, which I used back in those years). By replacing the BSPs, I fixed my performance. A lot of blockouts and students projects never get to a stage of replacing BSPs for static geo. That is understandable - the BSPs serve a perfect purpose and the level created is a level design blockout, not something that needs to have finished set dressing. It’s not wanted to replace the brushes.
But by not replacing the BSPs, we’ve left in the scene a type of actor that carries an incredibly high amount of draw calls.
Issue
BSP Brushes cary a lot of information in them that gives them their custom dimensions. For example, a parallelepiped is represented by the length of each of its sides. In the options of the BSP we can change any of those sizes dynamically. We are given lots of freedom for iteration. That freedom comes at the cost of draw calls. Each object has more than one draw call (due to the dimension options in it). Each object is unique too, which makes it impossible to batch any draw calls.
Solution
BSP Brushes can be baked down (also called merge). They can be converted into a finalized, static geometry, that cannot be dynamically changed in dimensions. Through that bake, the draw calls are reduced to low amounts.
Merge Down BSP Brushes
The easiest way to win back our good performance, when using BSP brushes that we intend to keep in the level, is to bake down the BSPs.
Step-by-step how-to for merging down BSPs:
- Select the BSP Actor that you want to turn into ordinary static geometry;
- In the right hand menu, look in the “Details” of the Brush component;
- Click on “Advanced”;
- Press “Create Static Mesh”;
- Pick the location to save it;
- Done. Engine does the rest.
The engine will save a new static mesh that is in the shape of your BSP. It will also replace your old “Brush Component” for a “Static Mesh Actor” that has more efficient draw calls and is the result of the bake down we just did.
The steps, illustrated:
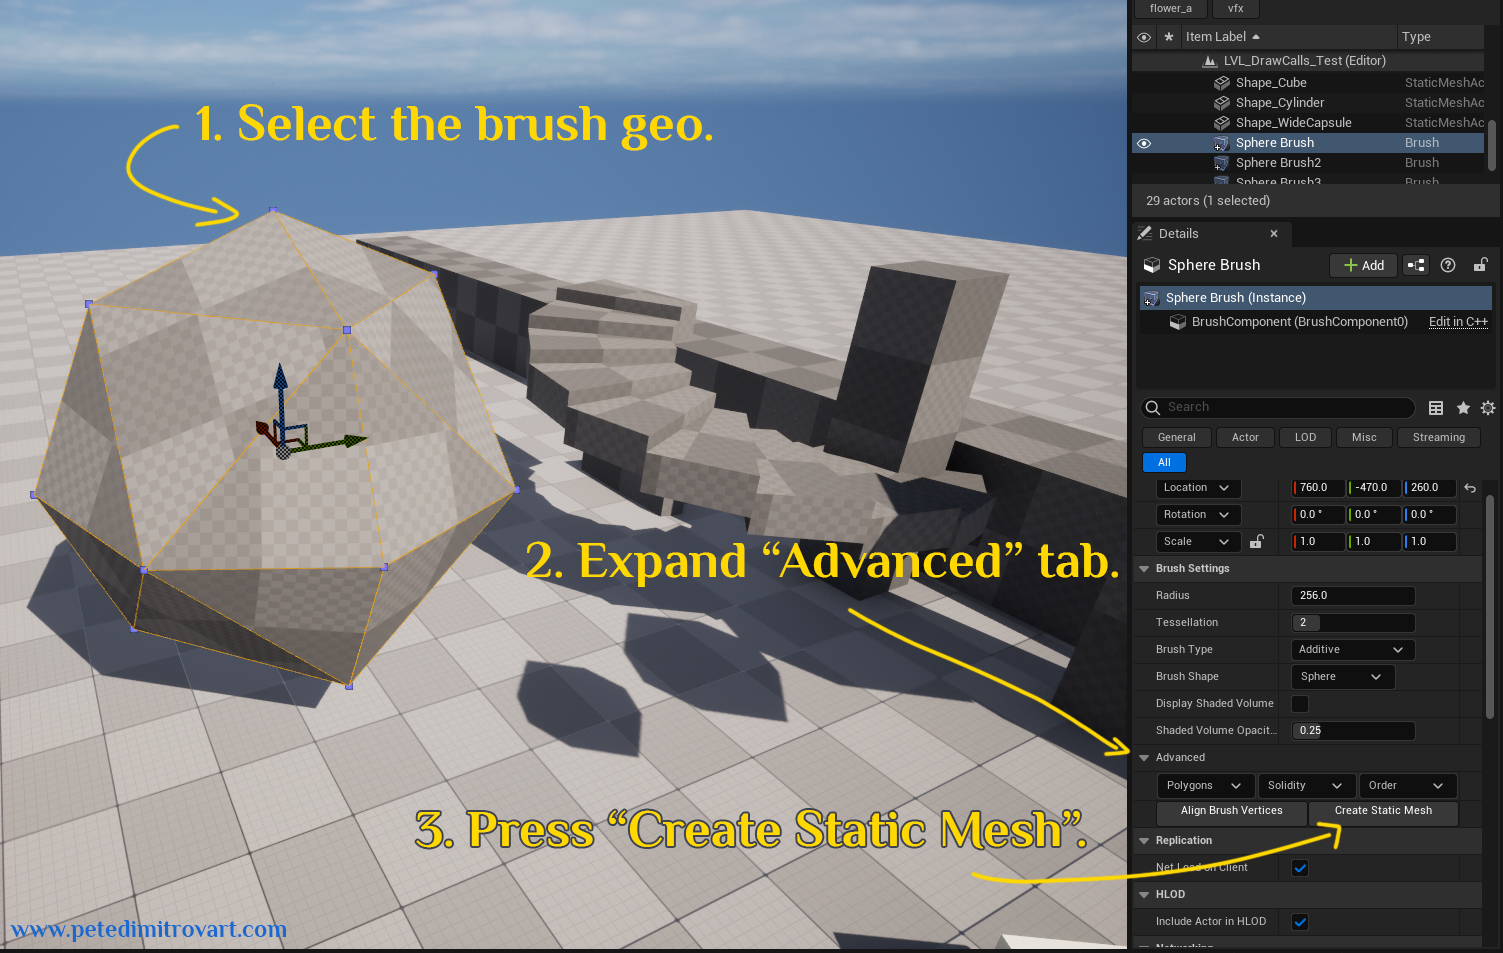
Select the brush geo. Expand “Advanced” tab. Press “Create Static Mesh”.
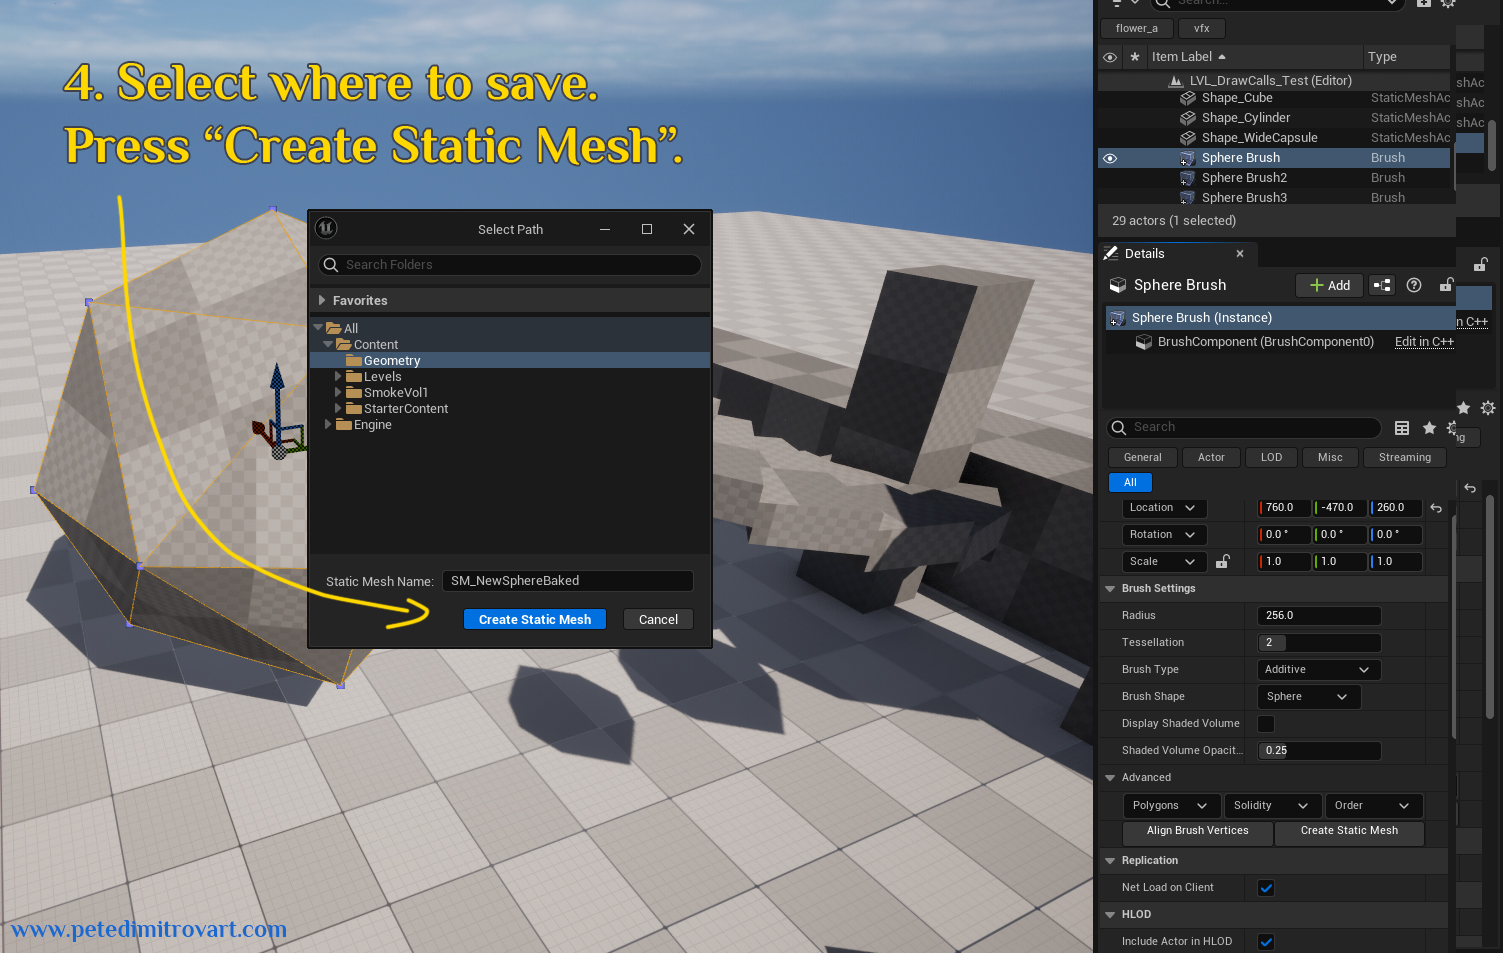
Select where to save. Press “Create Static Mesh” (blue button seen above).
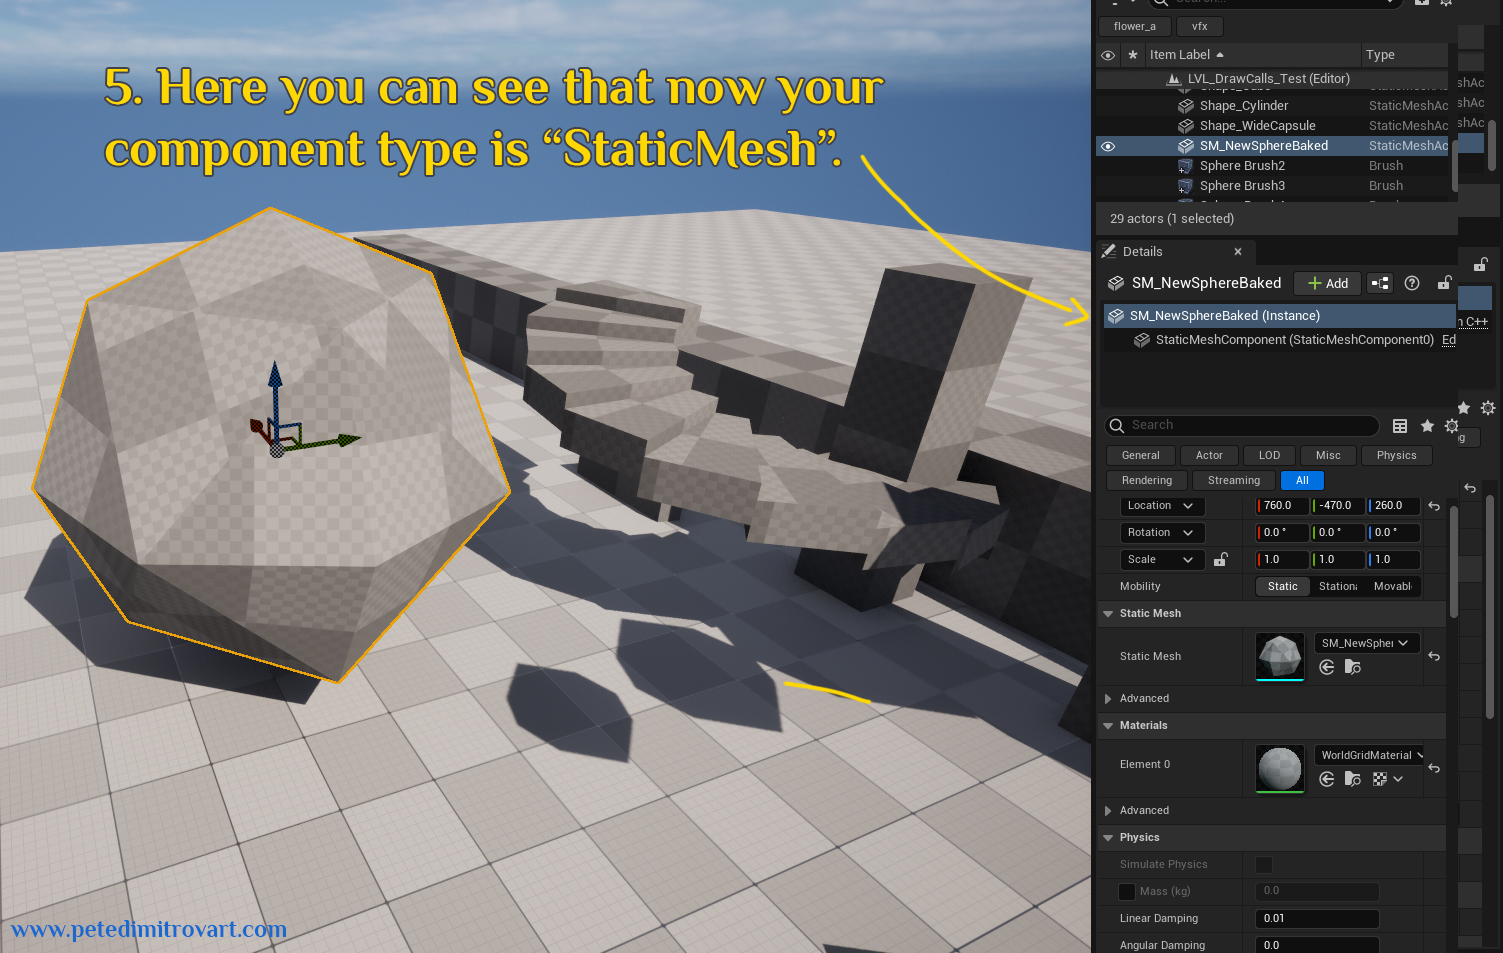
Here you can see that now your component type is “Static Mesh”. We turned the “Brush Component” (has lots of draw calls) into “Static Mesh Component” (has manageable, lower amount of draw calls).
You can go over your scene and do that for each unique type of geometry shape you’ve created. After turning one shape into a static geometry, replace any other BSPs visually similar to it for the newly created static geometry.
Proof
But we jumped to the solution above, without me presenting any evidence. Lets say that before you went through all of the ordeal of merging and baking down your geometry, you wanted to see proof that indeed BSP brushes are as bad as I describe them to be. Here is some:
cmd
stat scenerendering
Easiest way to see some evidence is to analyze the draw calls amounts on a screen at a given time and compare it to the same screen but with some of the “static mesh” actors swapped instead for “BSP brush” actors.
What we expect to see, given all of the reasoning I went through so far, is that the “static mesh” actors filled screen will be low on draw calls. The screen filled with “BSP brush” actors instead will be incredibly high on draw calls.
We can do exactly that by using the console command seen above, inside Unreal.
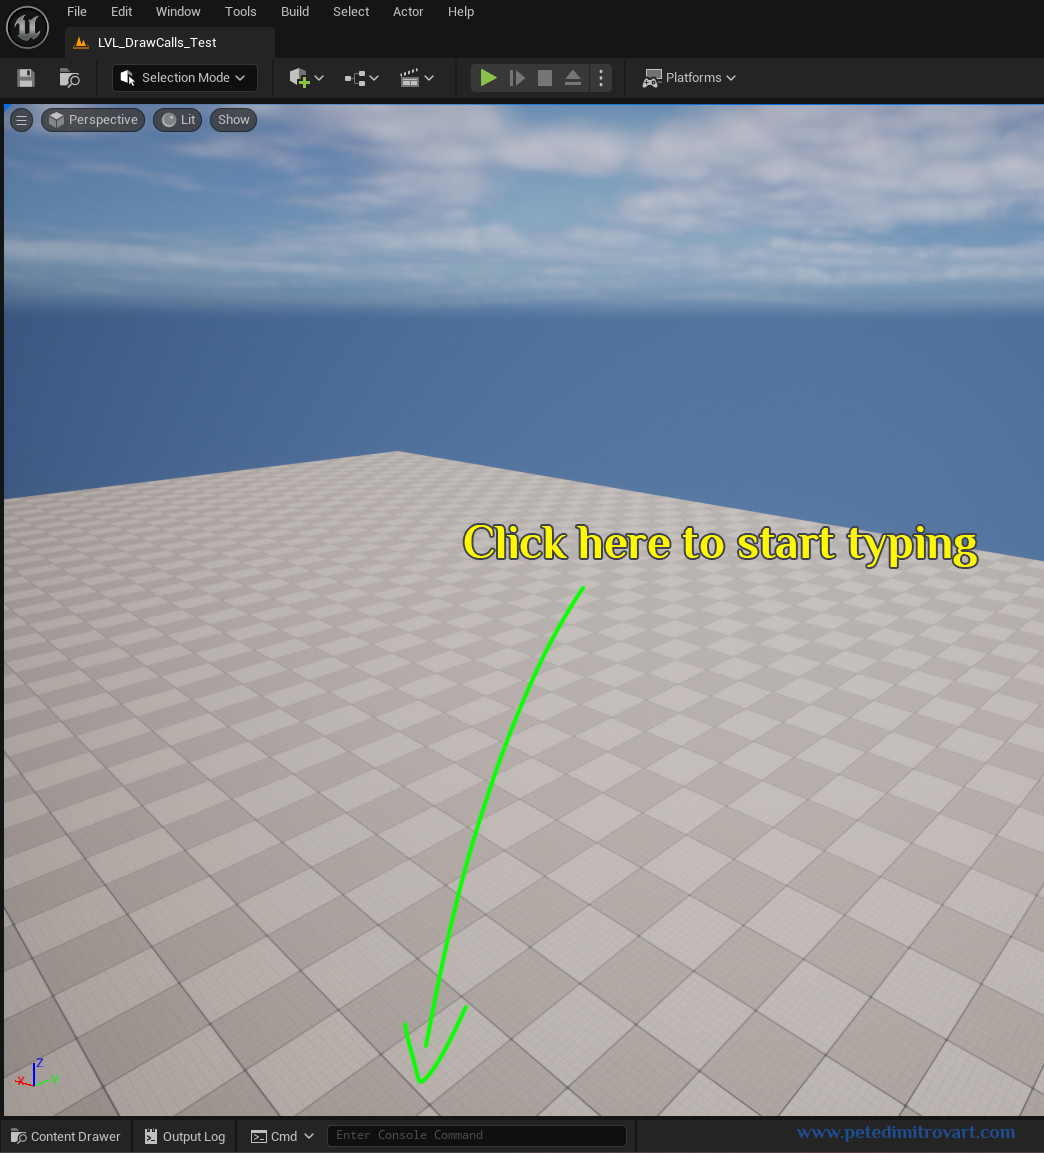
Click on the cmd seen above and start typing. Write:
|
|
Then hit “Enter” on the keyboard. A profiling window in green colors will show up on the screen.
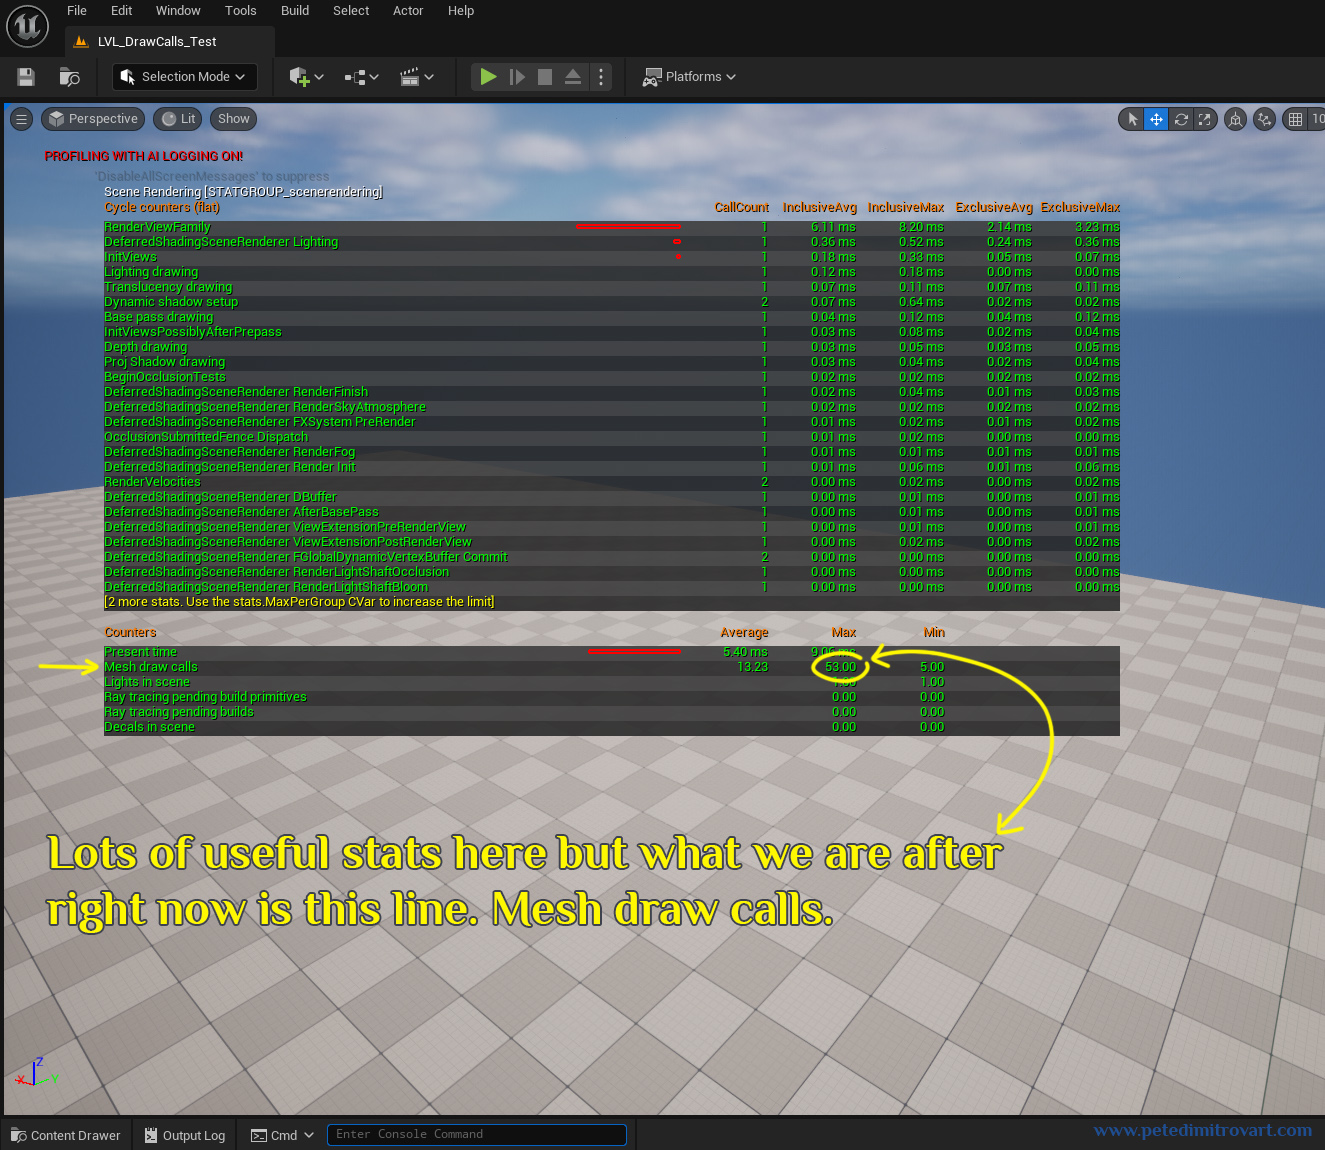
I’ve circled the line above which we are after on this newly popped up “Scene Rendering” profiling screen. We can see that Mesh draw calls are max 53.00 and min 5.00. That is expectedly low amount given that right now our camera frustum (viewing frustum) is looking at a mostly empty corner of the level.
Example
Now lets look at a part of the screen with some static meshes and BSP brushes.
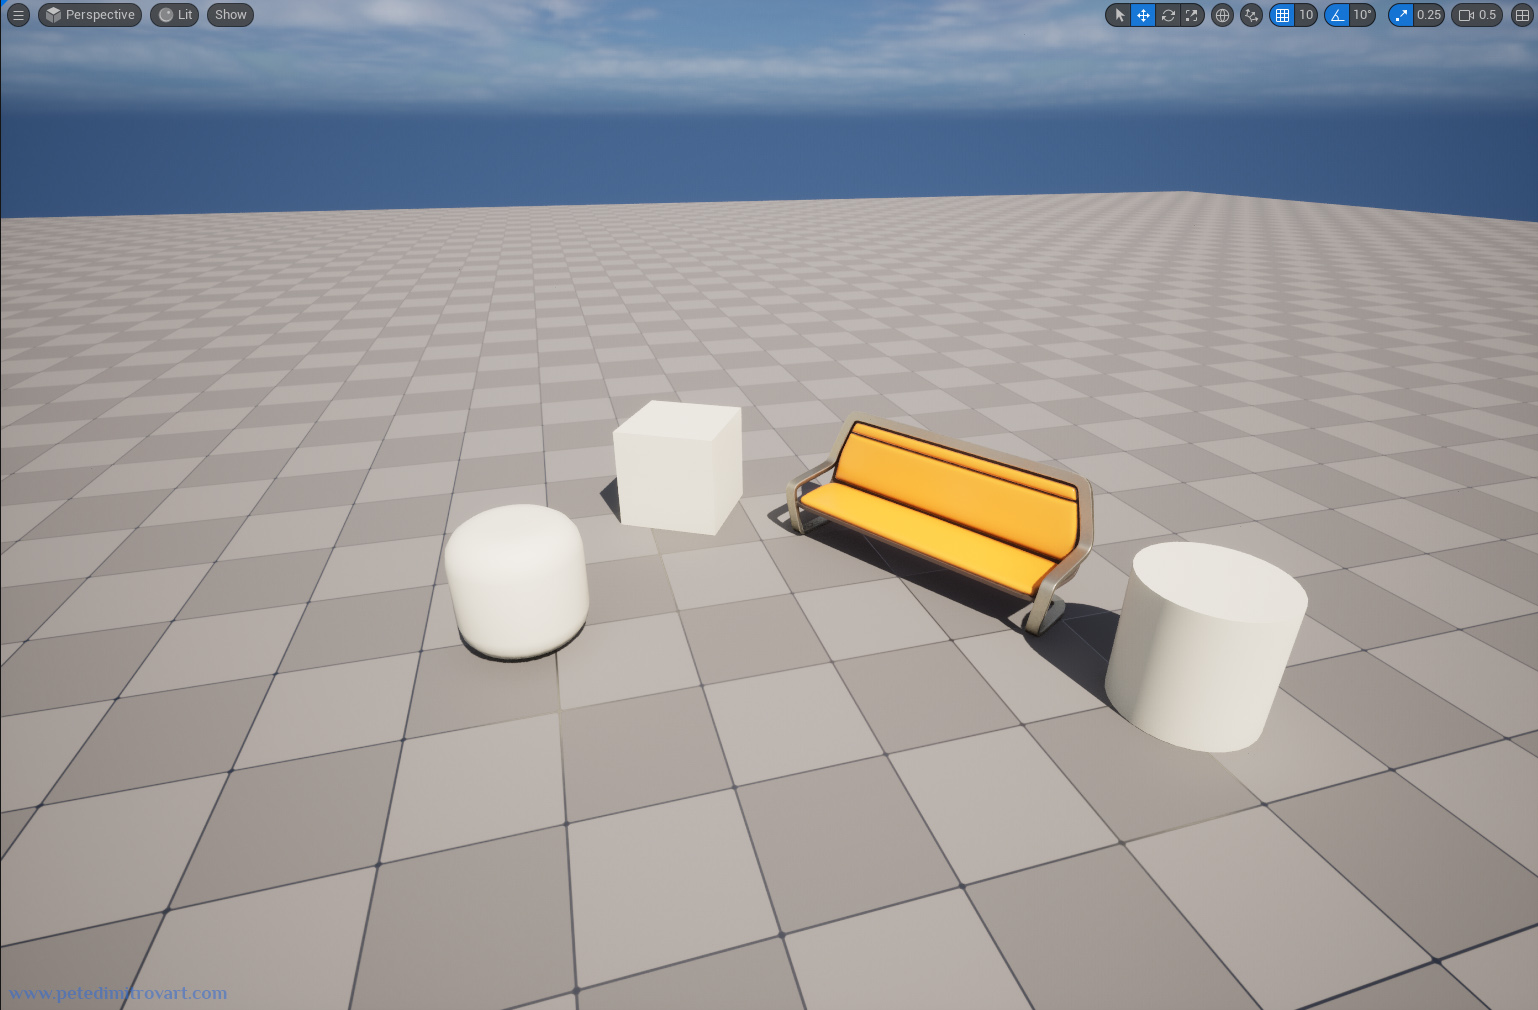
Image above showcases a scene with a few assets of type “Static Mesh”.
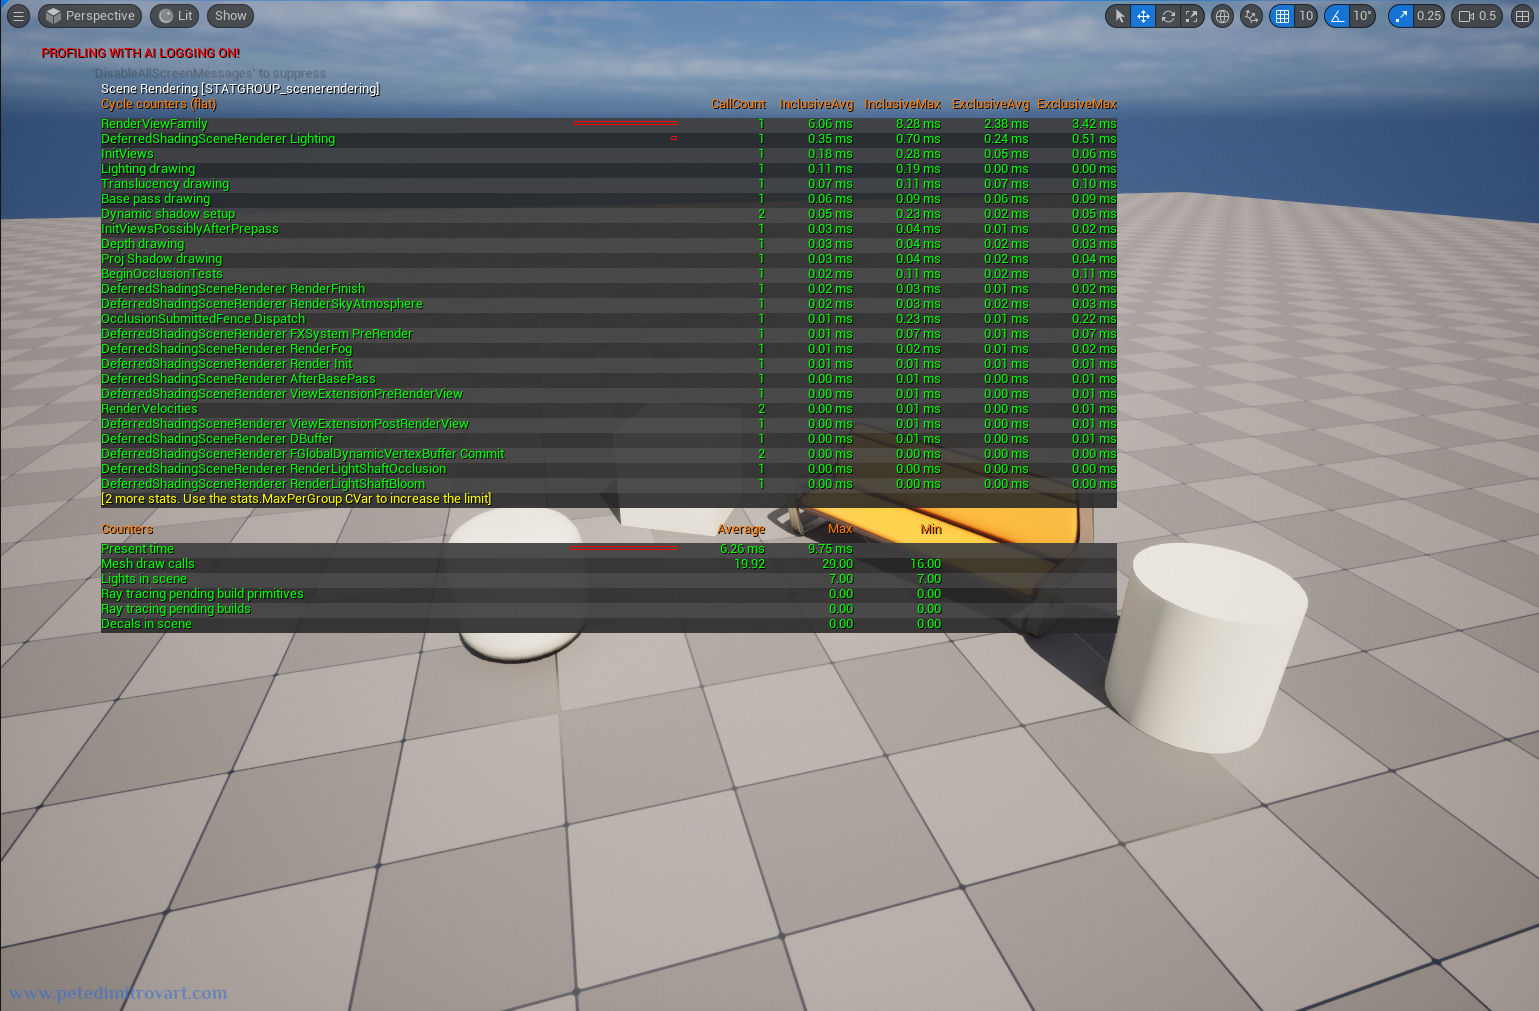
Once we do “stat scenerendering” on the screen we see that the mesh draw calls of this scene are low. Average of 19.92 and max of 29.00 (seen above).
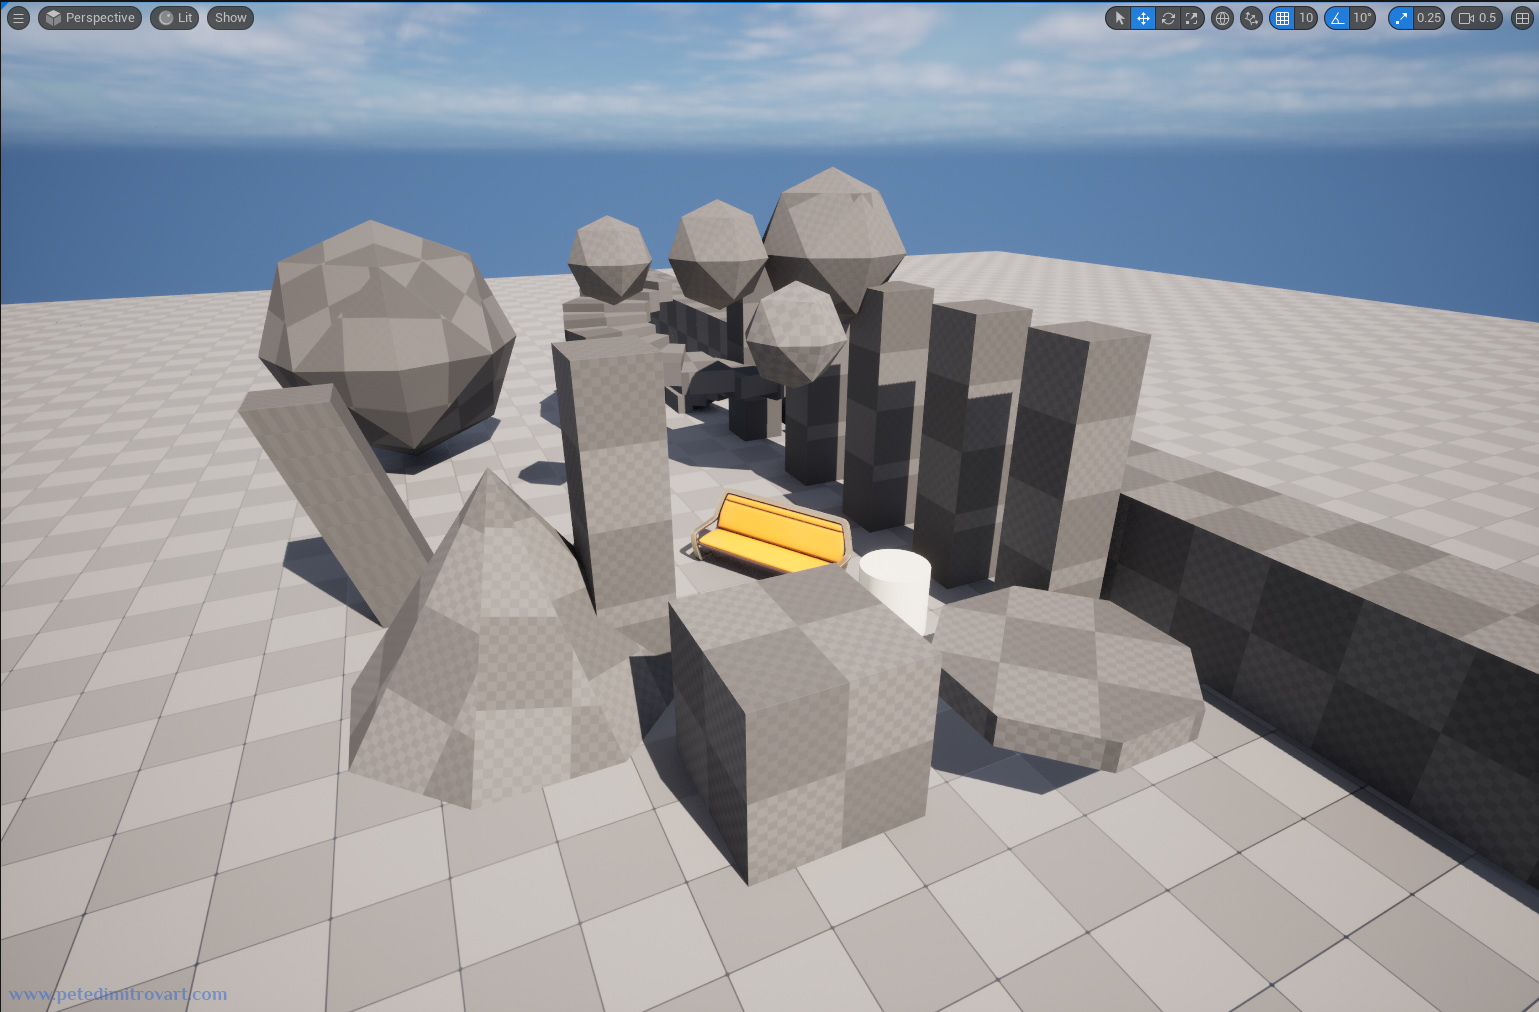
Next up, in image above, we add a bunch of BSP brush actor types to the scene. Those are in the form of various geometry primitives but the important part is that they are BSP brushes.
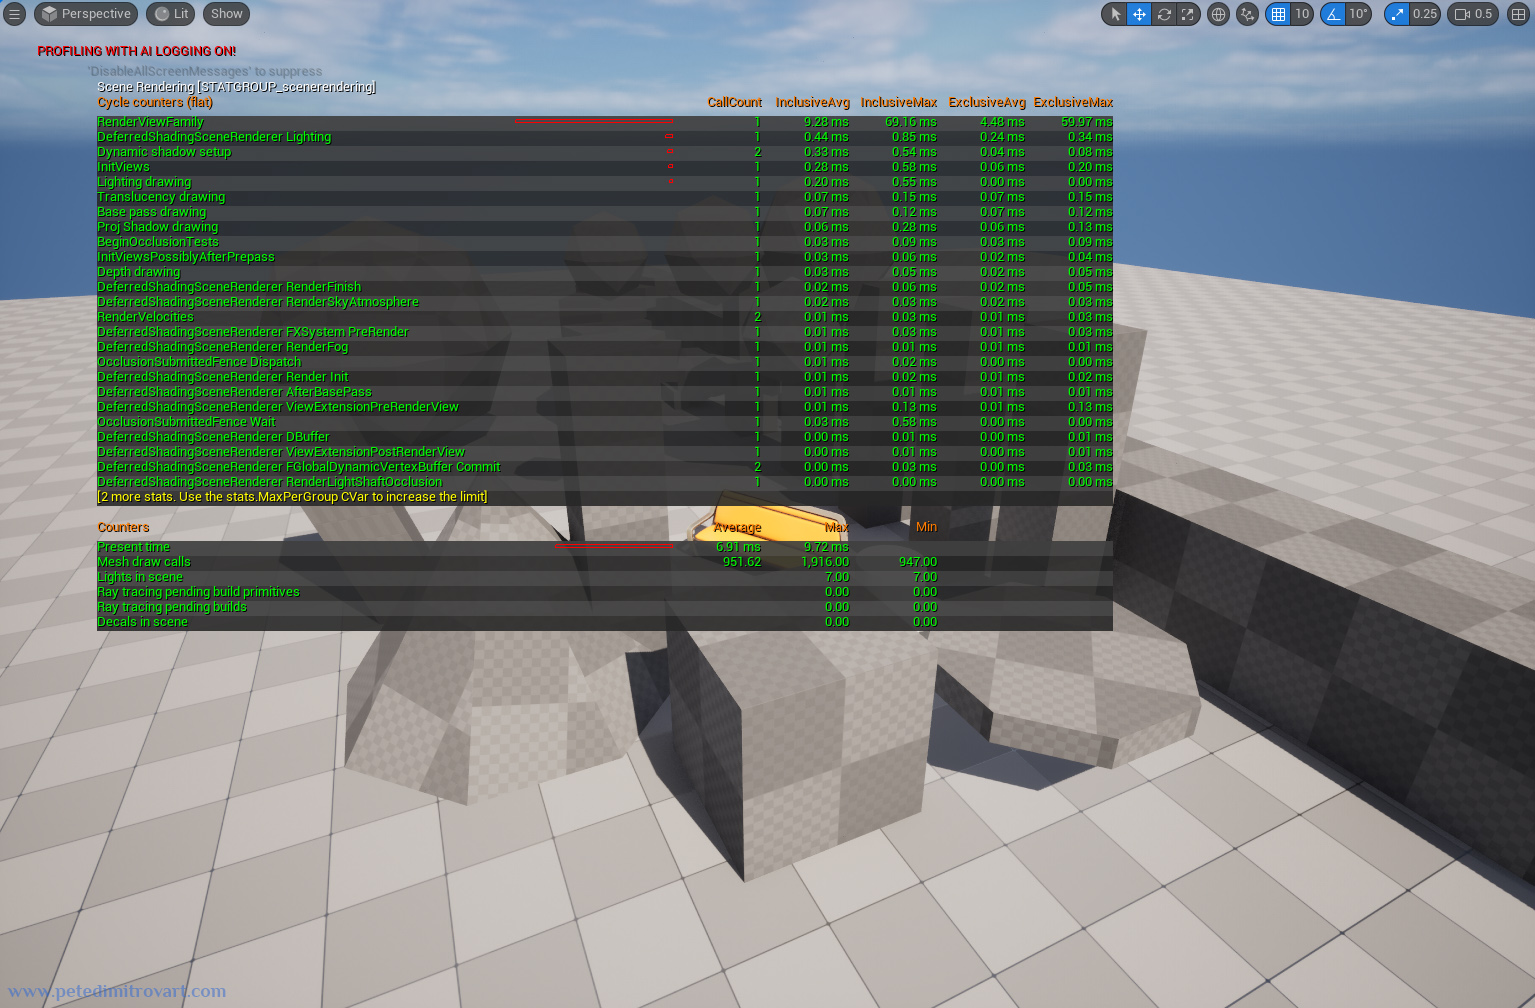
Once we again do “stat scenerendering” on the screen above, we see that now our draw calls have sky-rocketed. On average they are 951.62 and on max they even go as high as 1,916.00.
This large number, as explained already, is due to the BSP brushes.
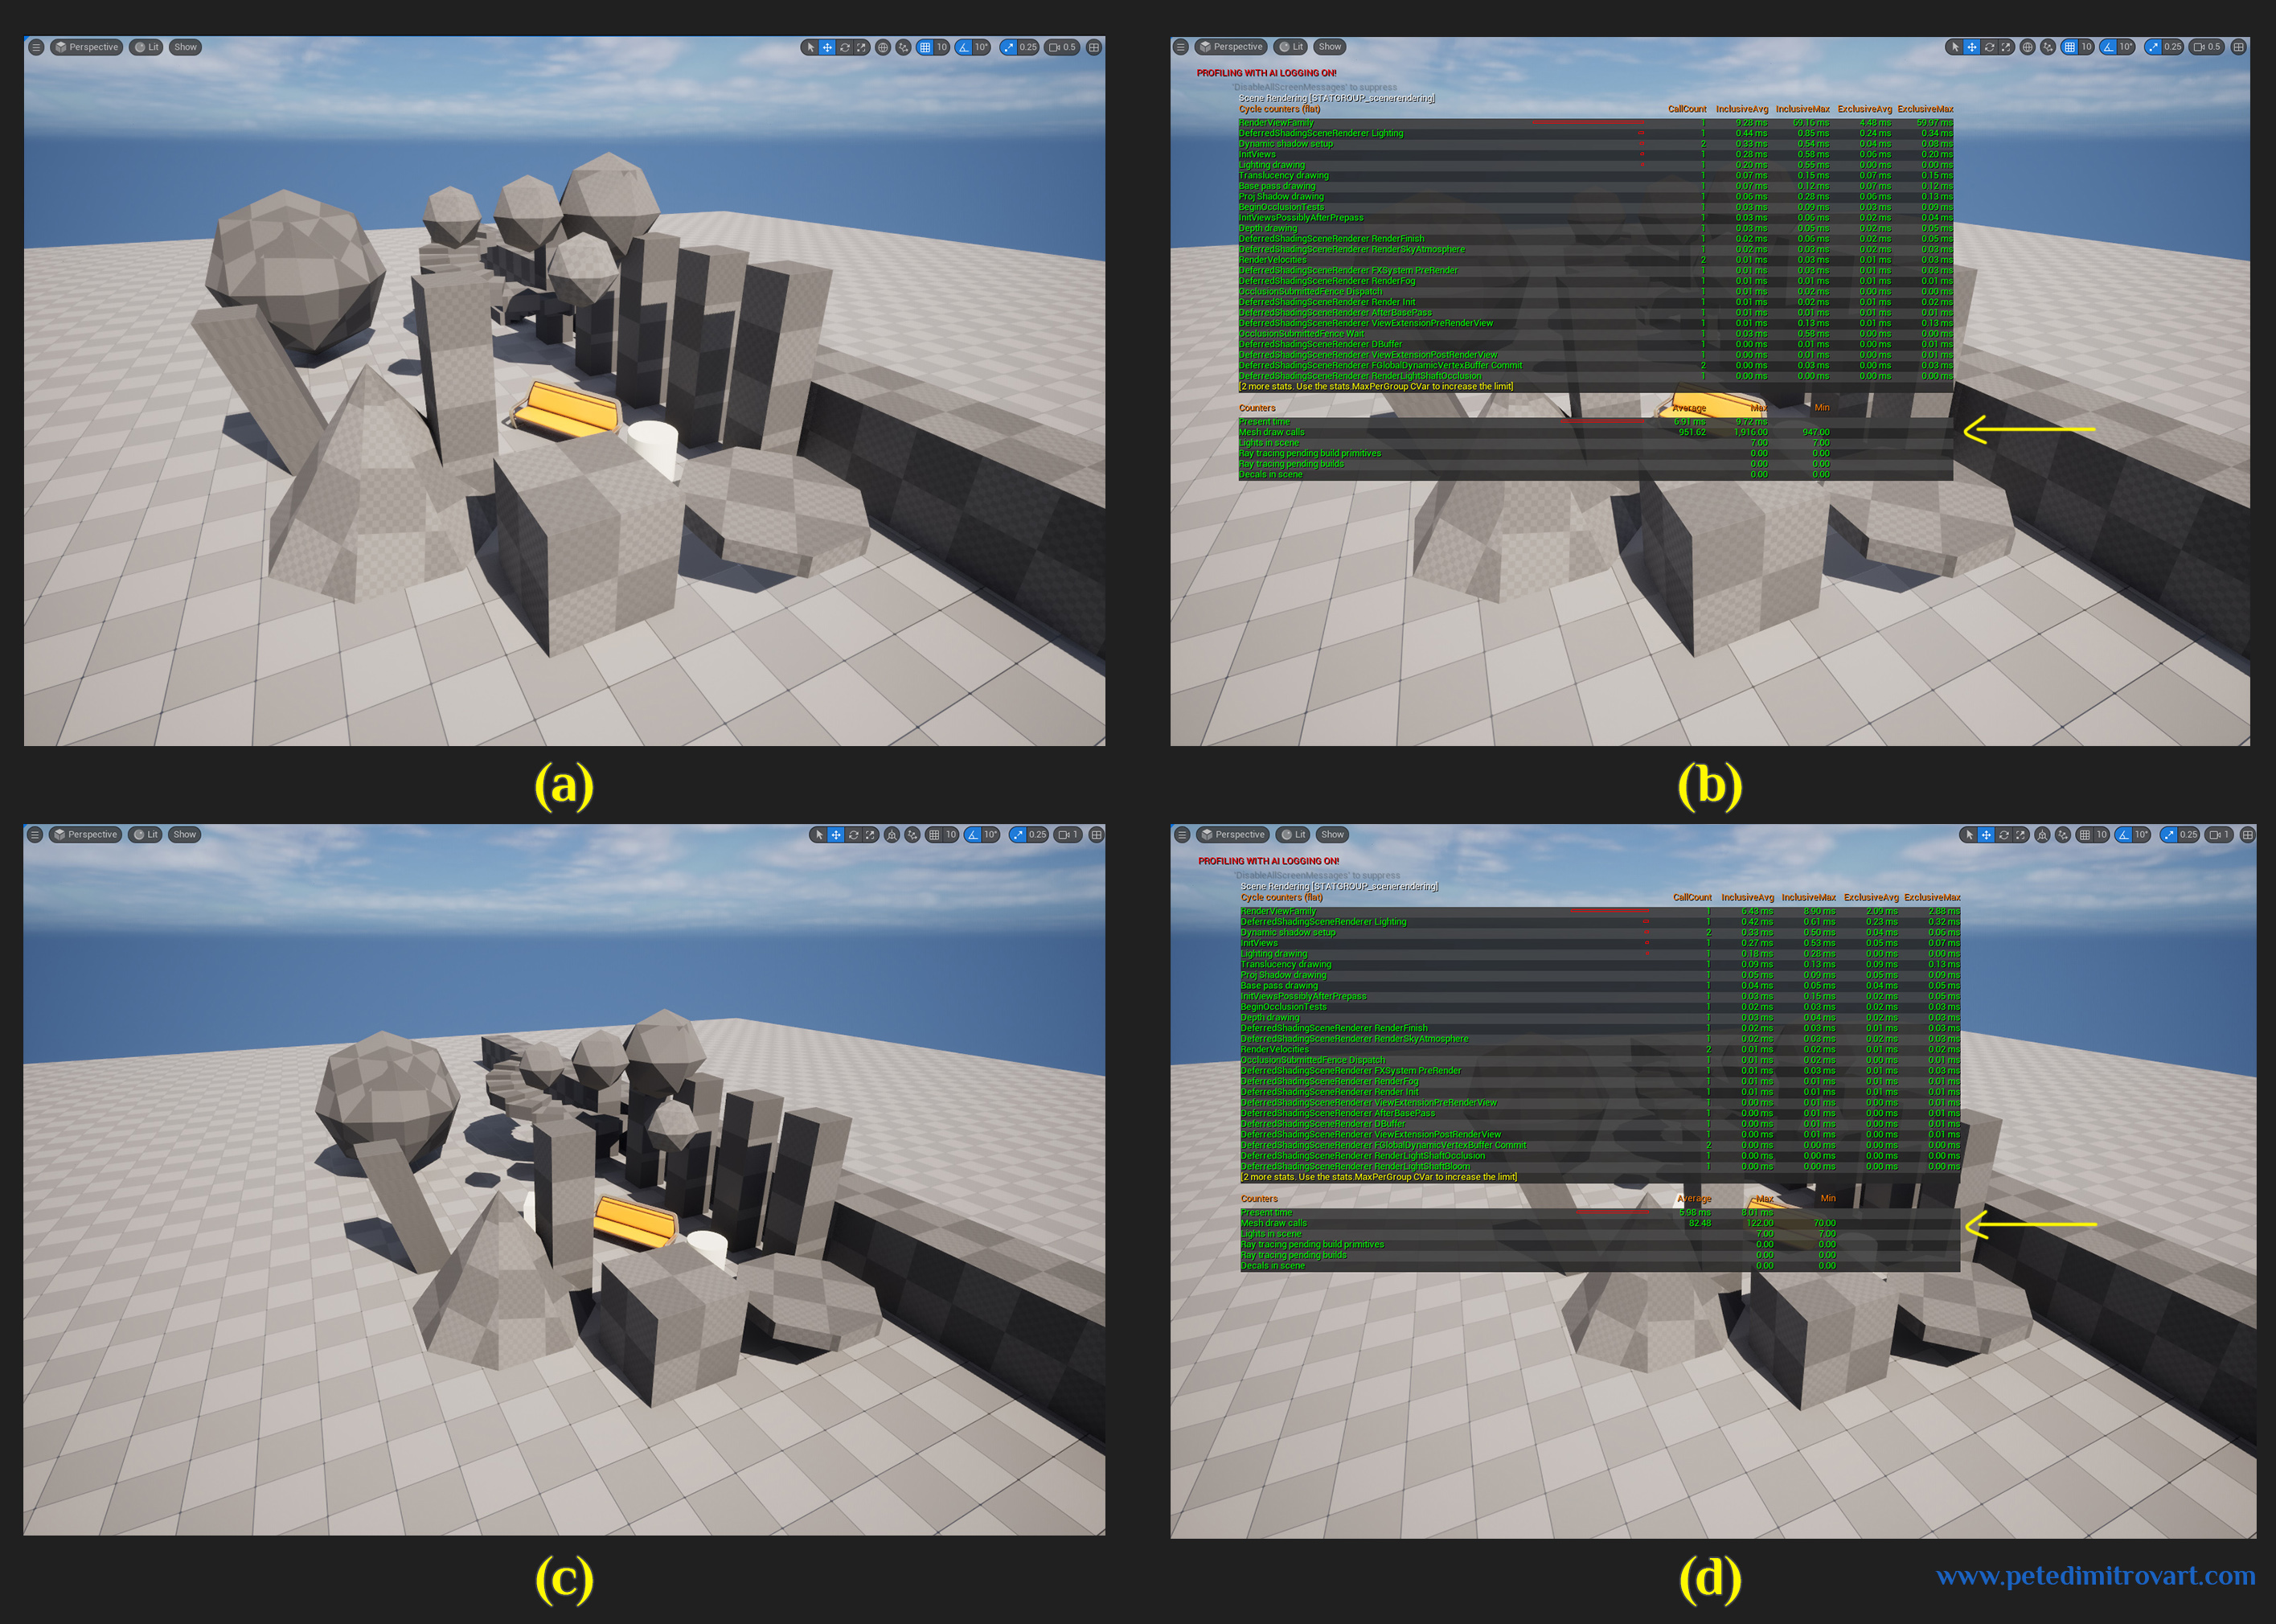
In this final figure, we have top row images (a) and (b), consisting of the scene full of BSP Brushes.
In the bottom row, images (c) and (d), we have used the technique described in this blog post and have turned the BSP brushes actors into static meshes.
The visuals between (a) and (c) are identical. Yet the scene in (b) that had BSP brushes has average of 951.62 draw calls. The scene with only static meshes, seen in (d), has 82.48.
Conclusion from comparison above:
BSP Brushes, as seen above introduce lots of needless draw calls. Keep your level blockouts and your environment art scenes free of them by converting to static meshes and your performance will be much higher.
Blueprint Actors
Short explanation
Did you intend to use some geometry as static? Did you turn it into a blueprint because you wanted to attach something else that is static to it? If yes, then turning it into a blueprint might have turned it into “movable” geometry that then has increased draw calls and can’t bundle in draw calls with instances (copies in the level) of itself.
As such, go into the newly made blueprint with static art set dressings and make sure you set the root and the children geometry inside all as “Static” instead of “Movable”. All solved!
Long explanation
Working with Blueprints is a smart thing to do. It definitely is the right approach no matter if you are doing level design, mechanics or environment art and set dressing.
Even though a lot of people who start in Unreal for the first time might not see the use of Blueprints past gameplay and mechanics, there is in fact lots to extract from blueprints when doing set dressing.
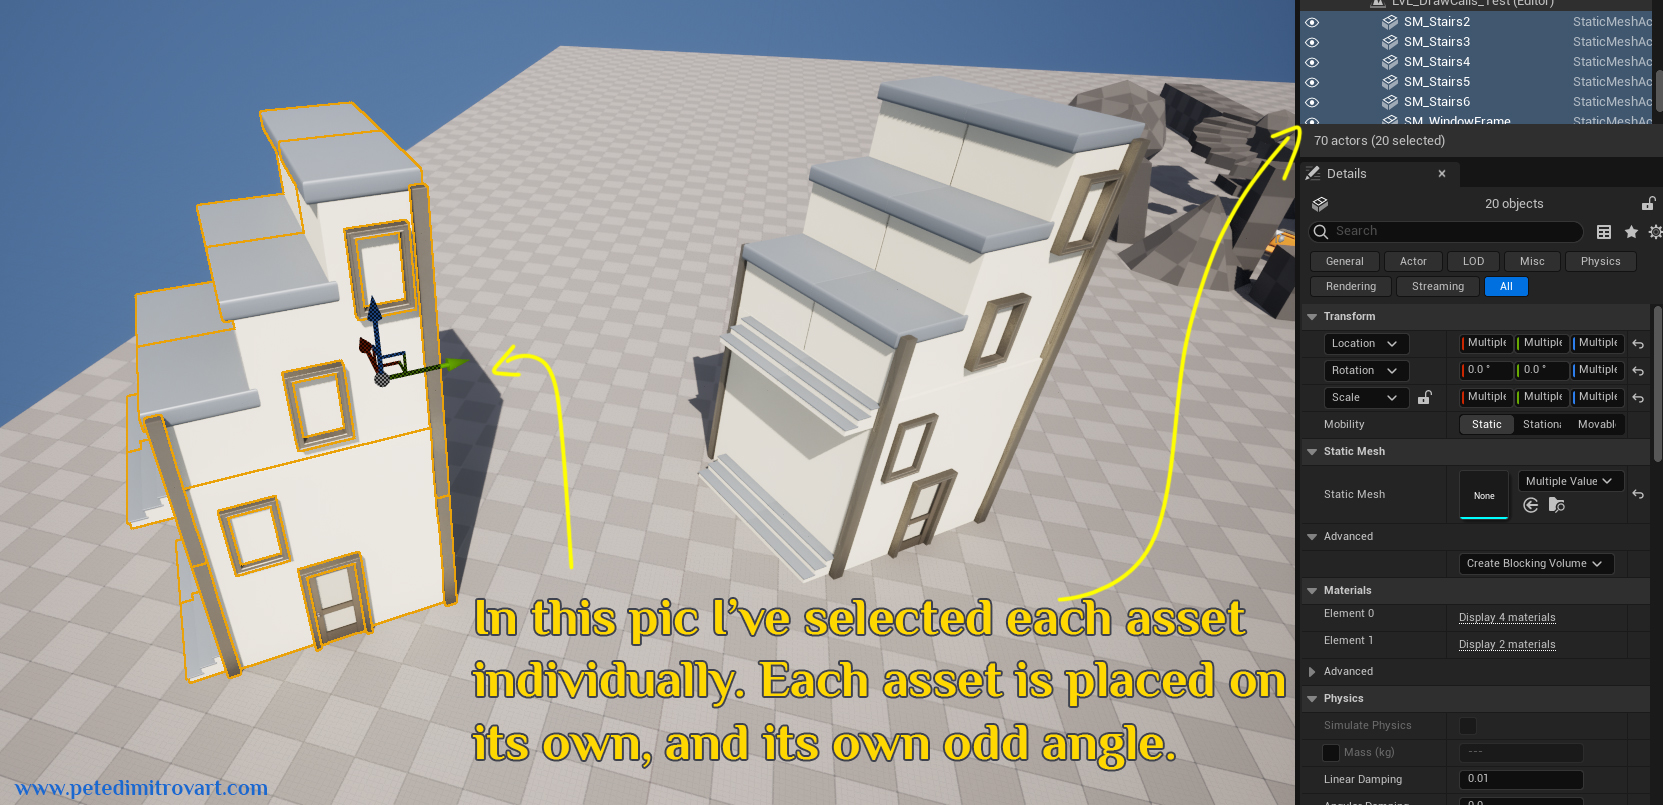
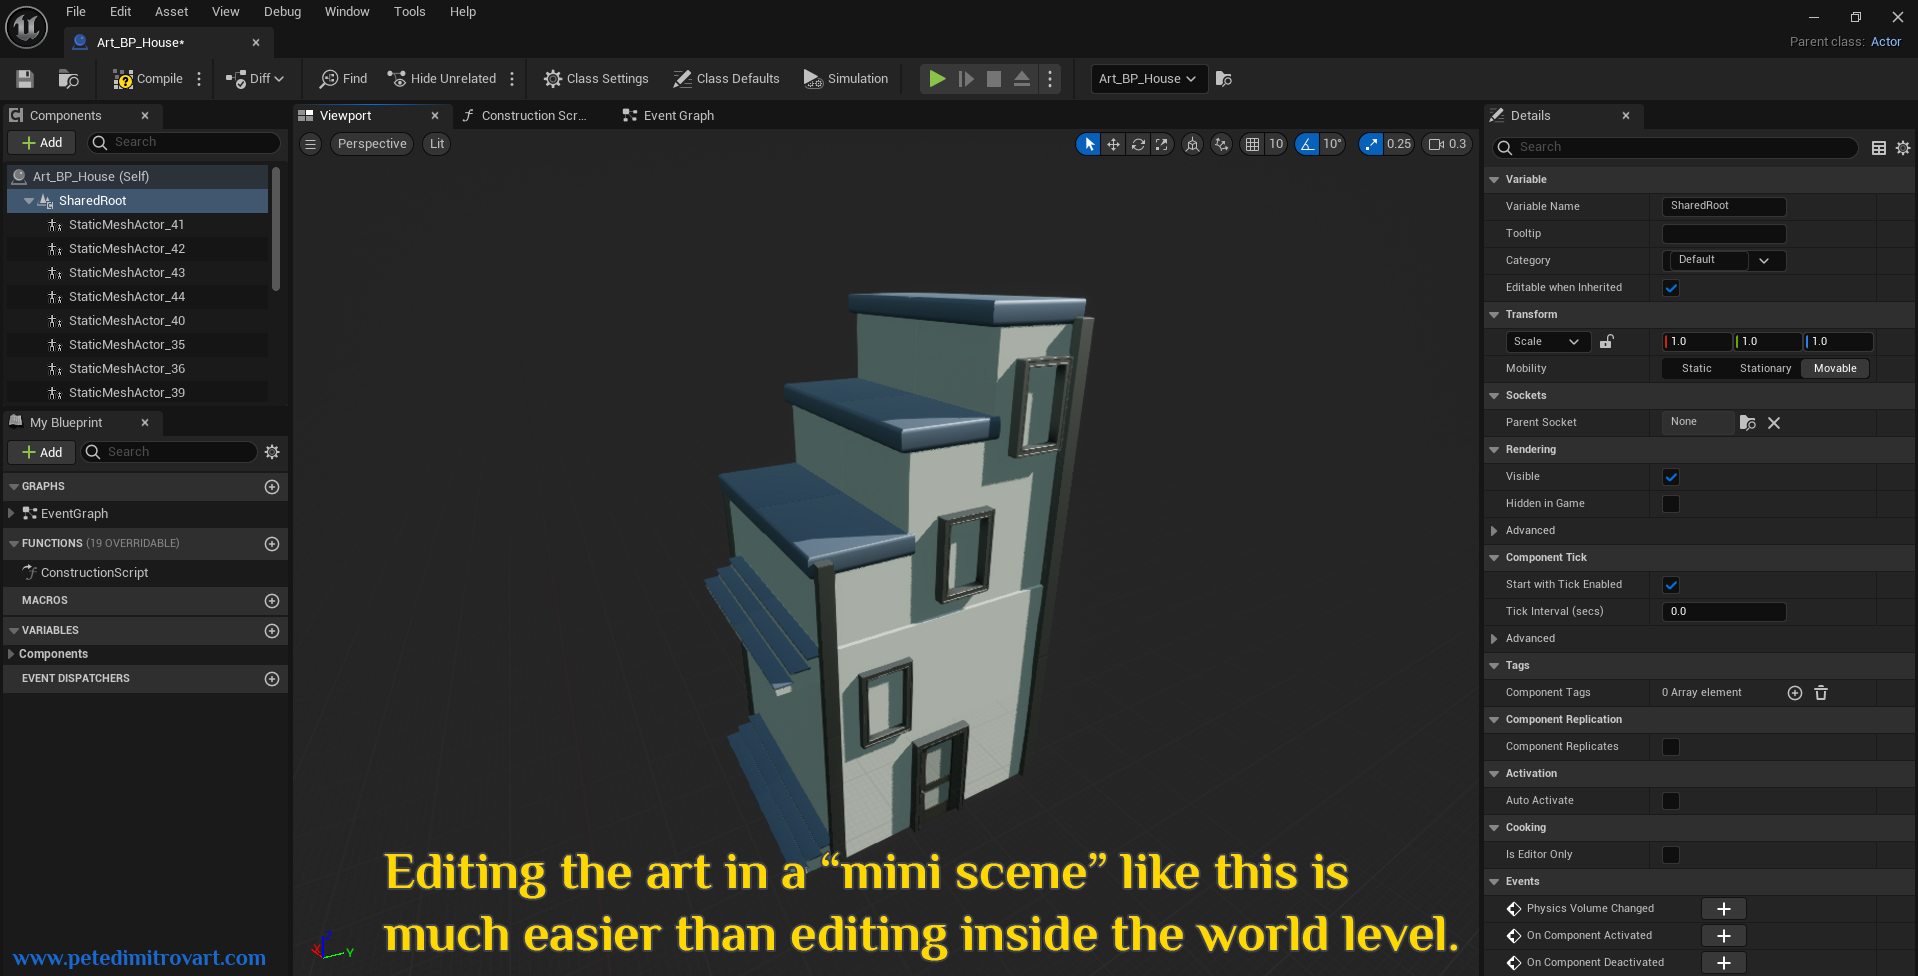
When making environment art, it can sometimes be slow to work directly into the world, in world space. You create a building and it is placed at an odd angle in the level. Every set dressing that might go onto its exterior, on its façade, you need to place at a similarly odd angle. An easier way to work instead would be to create “local space”. A bundle of assets - the buildings and its façade set dressings - placed in its own coordinates. That is exactly a blueprint. That “local space” bundle, then like a little template can be placed in the world, at an odd angle. It’s creation, through a blueprint, instead of directly working in “world space” was much easier.
(Below I made a silly looking house as a quick example. Ignore the fact it doesn't look amazing. I used Unreal starter project meshes with the idea of illustrating the explanations here a bit better.)
If you are working with multiple people and there is version control, this means you don’t need to commit changes to the world (the level) next time you want to improve the building. Instead you can edit the blueprint (the local space) and commit that change. The fixes and improvements will automatically propagate to every level where the blueprint was used.
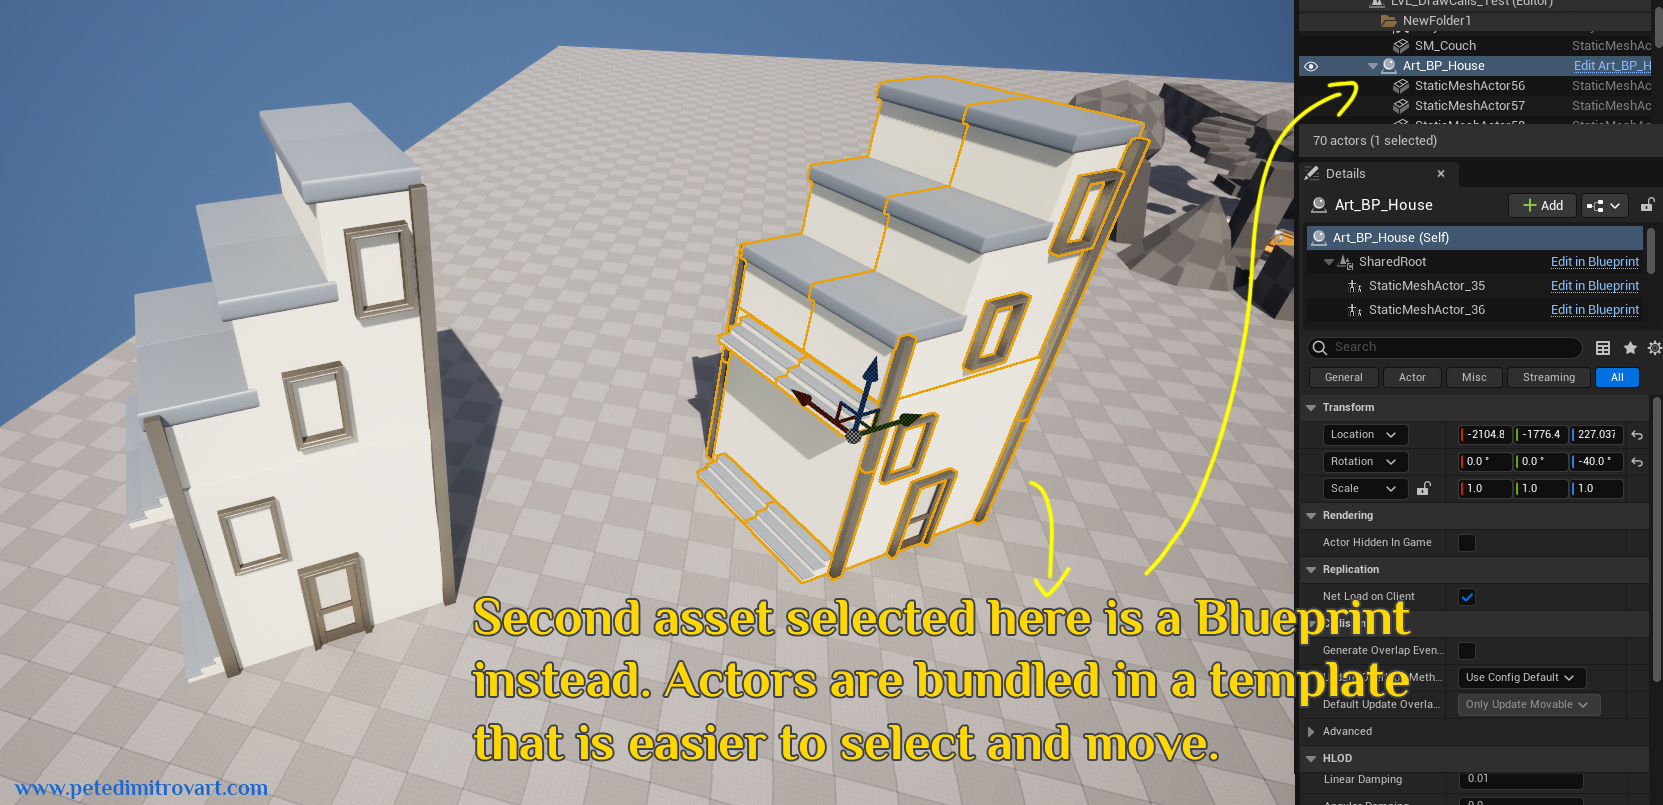
Hopefully this paints a picture of why its great to work with blueprints in order to build “templates” of environment art and set dressing. In the image below is seen one such template.
If you do the above, here comes the issue though, and the reason why you might have low performance next.
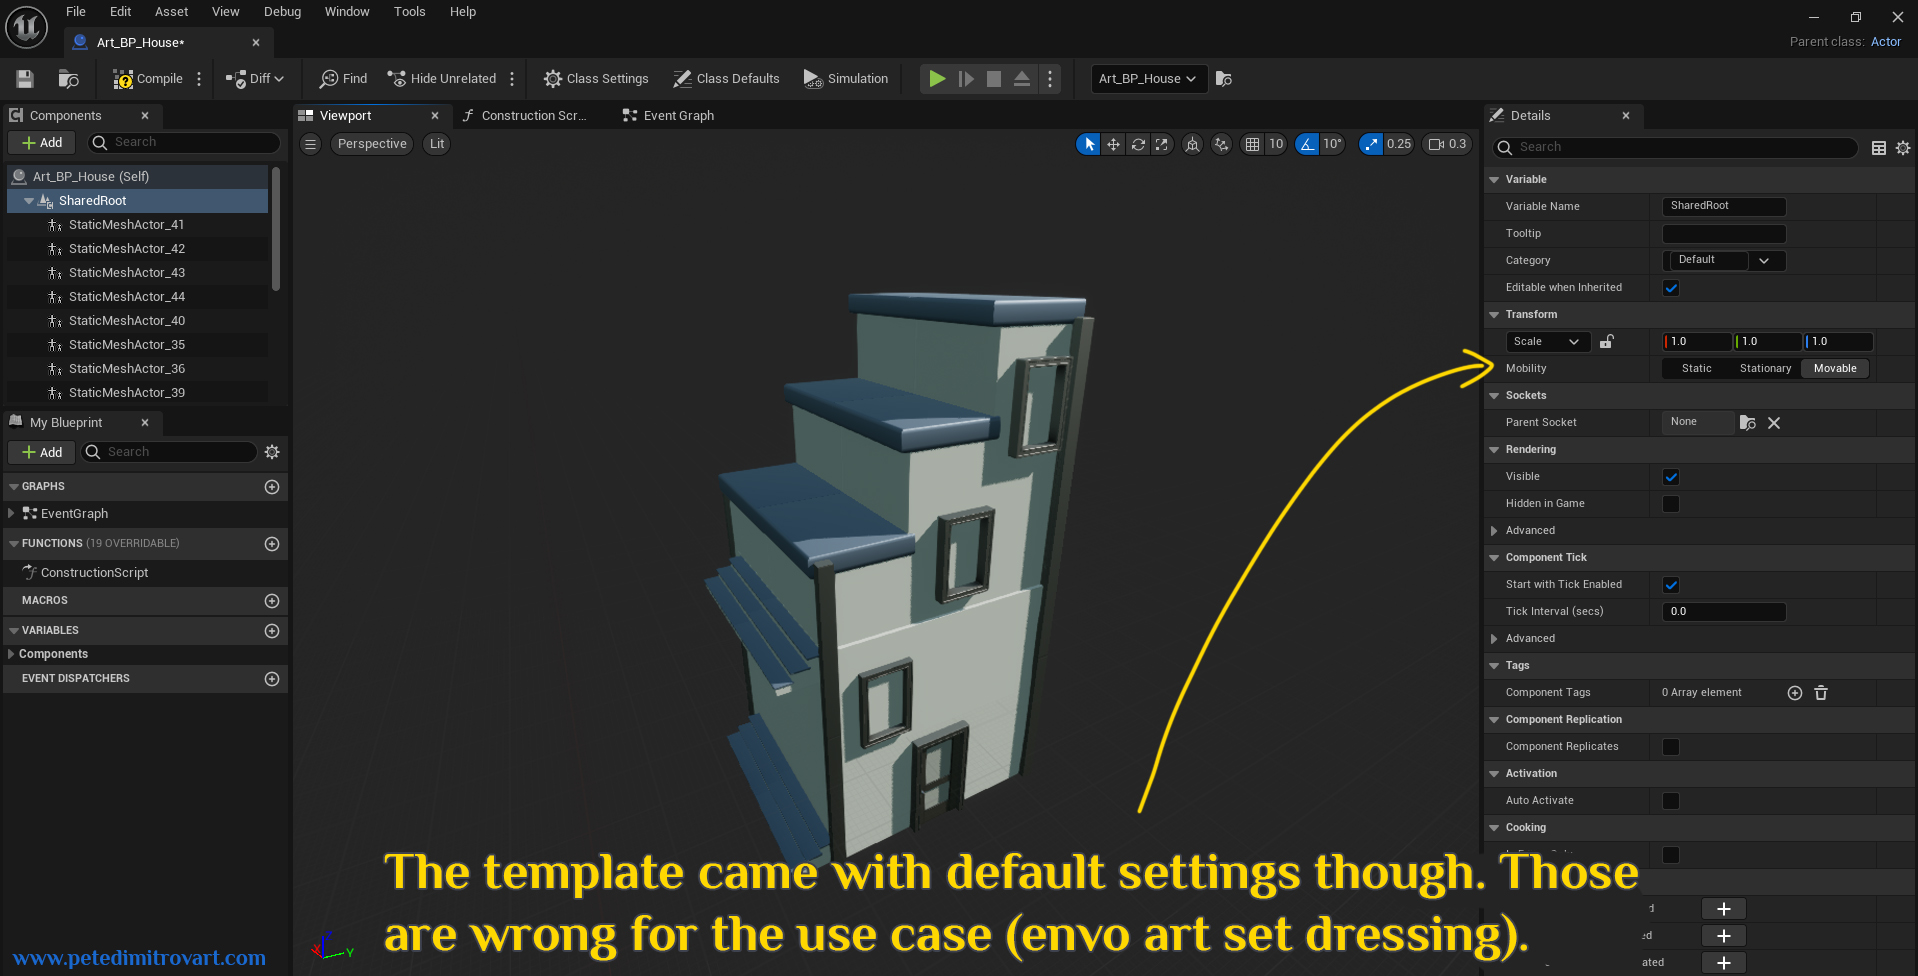
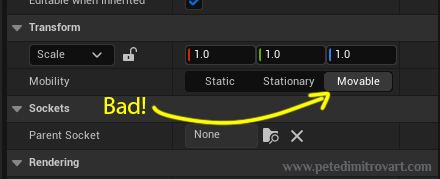
As seen above, the default settings when making a blueprint will set every static geometry inside to “movable” instead of “static”. As mentioned before, that increases draw calls. It’s also needless, as these pieces will be used as environment art that doesn’t ever move. We can fix it all by changing the mobility back to static, as seen in the next images.
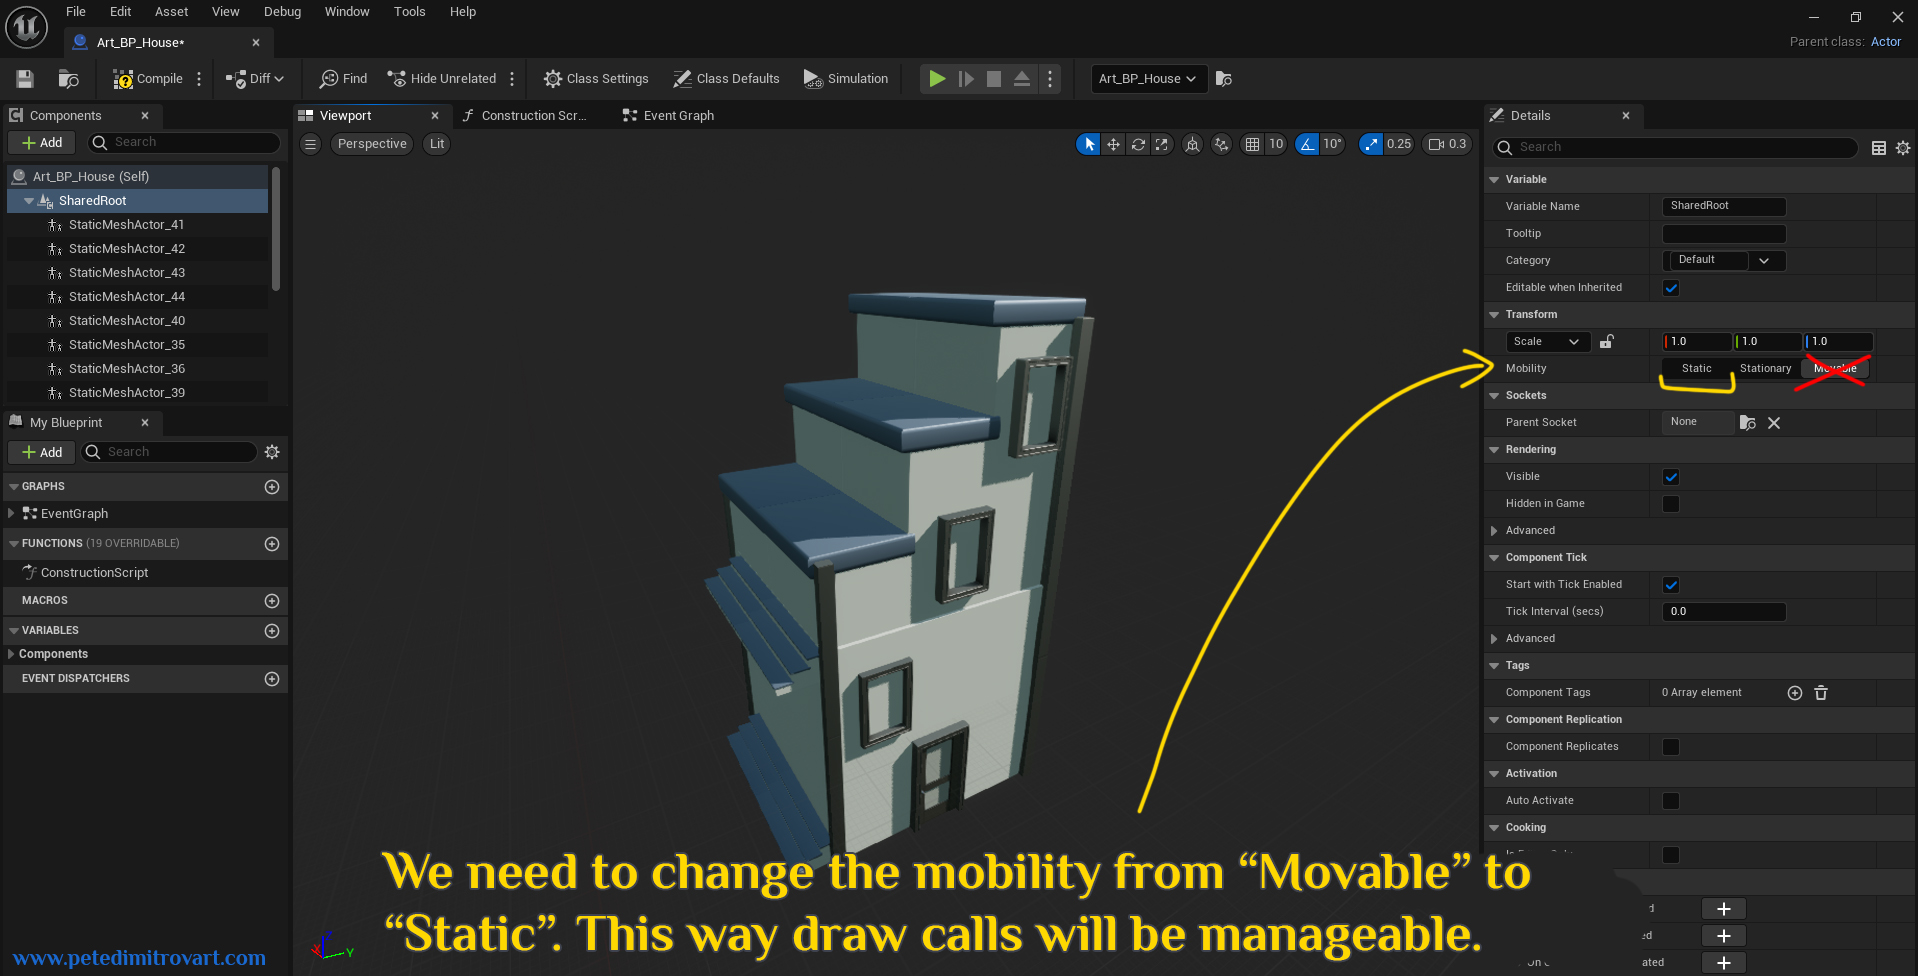
Yellow text above reads “We need to change the mobility from “Movable” to “Static”. This way draw calls will be manageable. In this step we changed the root and next we need to also change the mobility of any meshes under it as well.
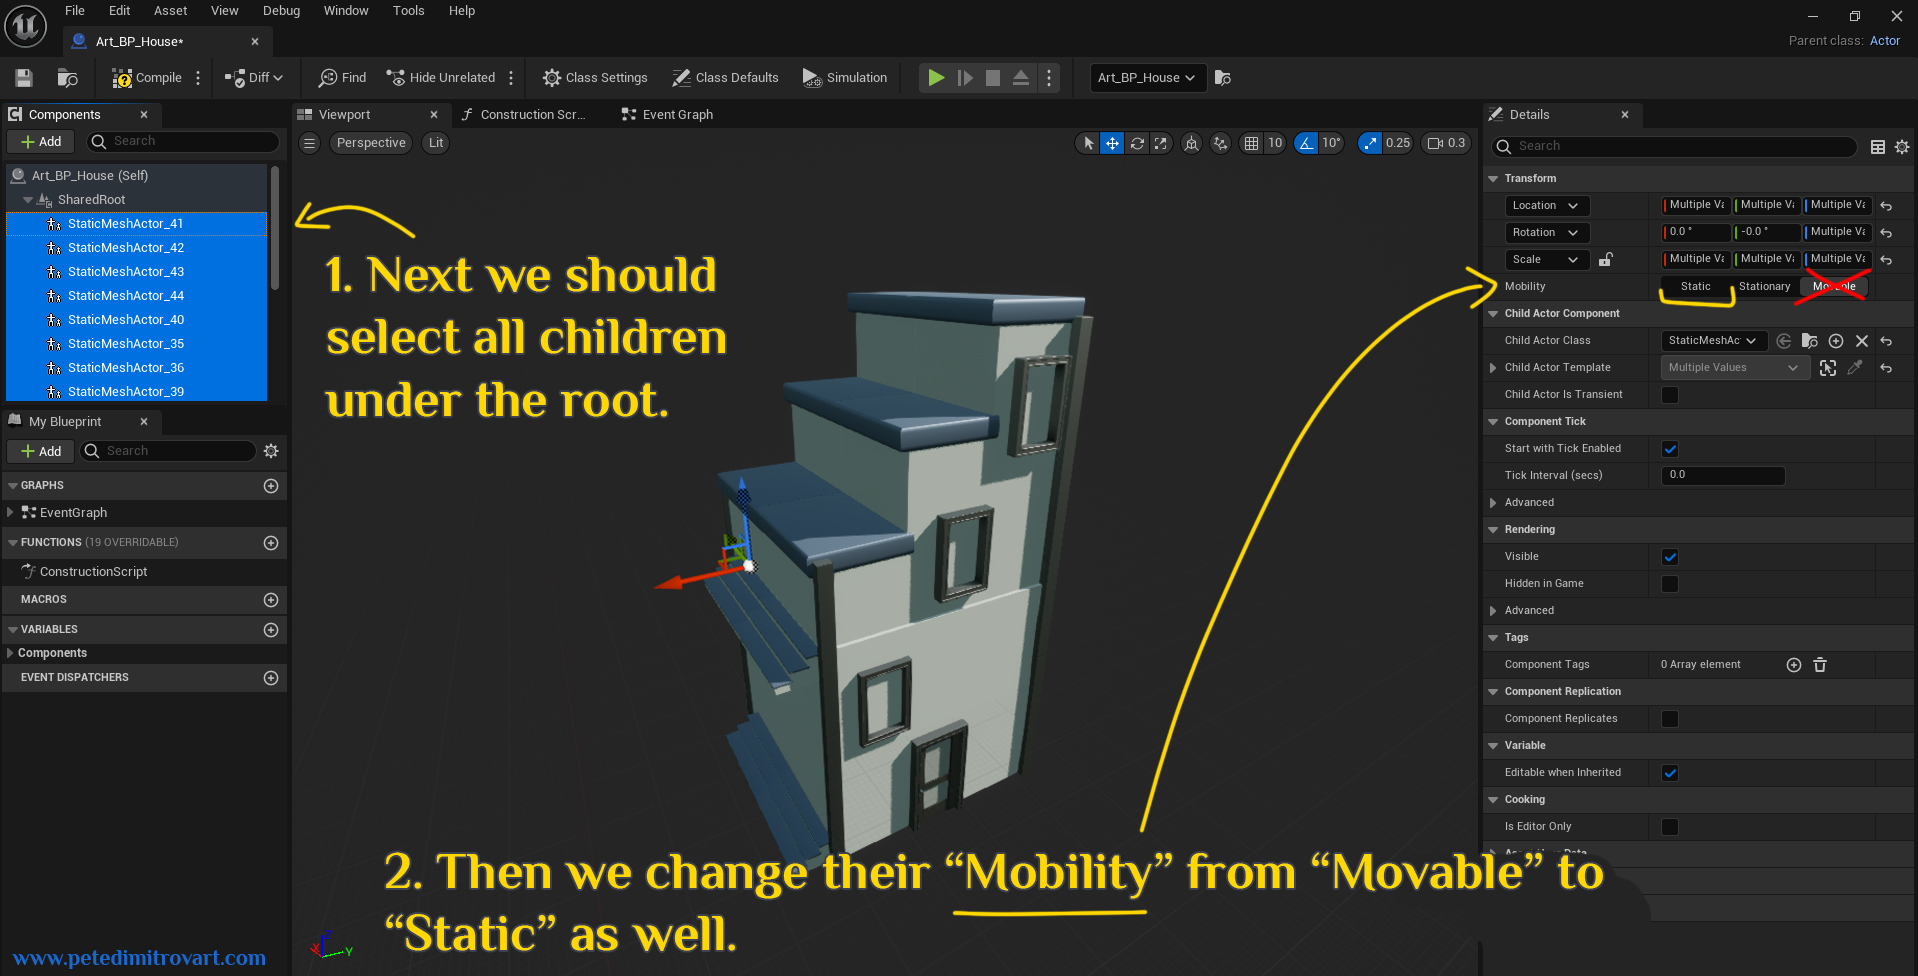
Image above instructs:
- Next we should select all children under the root.
- Then we change their “Mobility” from “Movable” to “Static” as well. A yellow arrow points to where to do that in the blueprint details panel.
Save the blueprint file changes and all is done. We are now all optimized on draw calls.
With all set to static, all is good and manageable in draw calls. Always pay attention to your mobility settings for new Blueprints and you will not have further performance issues related to the BPs.
Moving Drops and Loot
You’ve created a little game prototype. It consists mostly of blockout levels without any heavy graphics. You are a person interested in level design, as well as game design for gameplay mechanics and gameplay systems.
Your game prototype world is just the mentioned above: blockouts. You have also added some enemies and simple loot that spawns when the minions die. Perhaps you’ve also scattered and placed some predefined collectables in your level.
For a collectable to be easily spotted by the player, and for it to look interesting and like we could interact with it, you’ve decided to give it a simple animation. Something like the rotation around main pivot point, as seen by the colorful, little gems in Spyro.
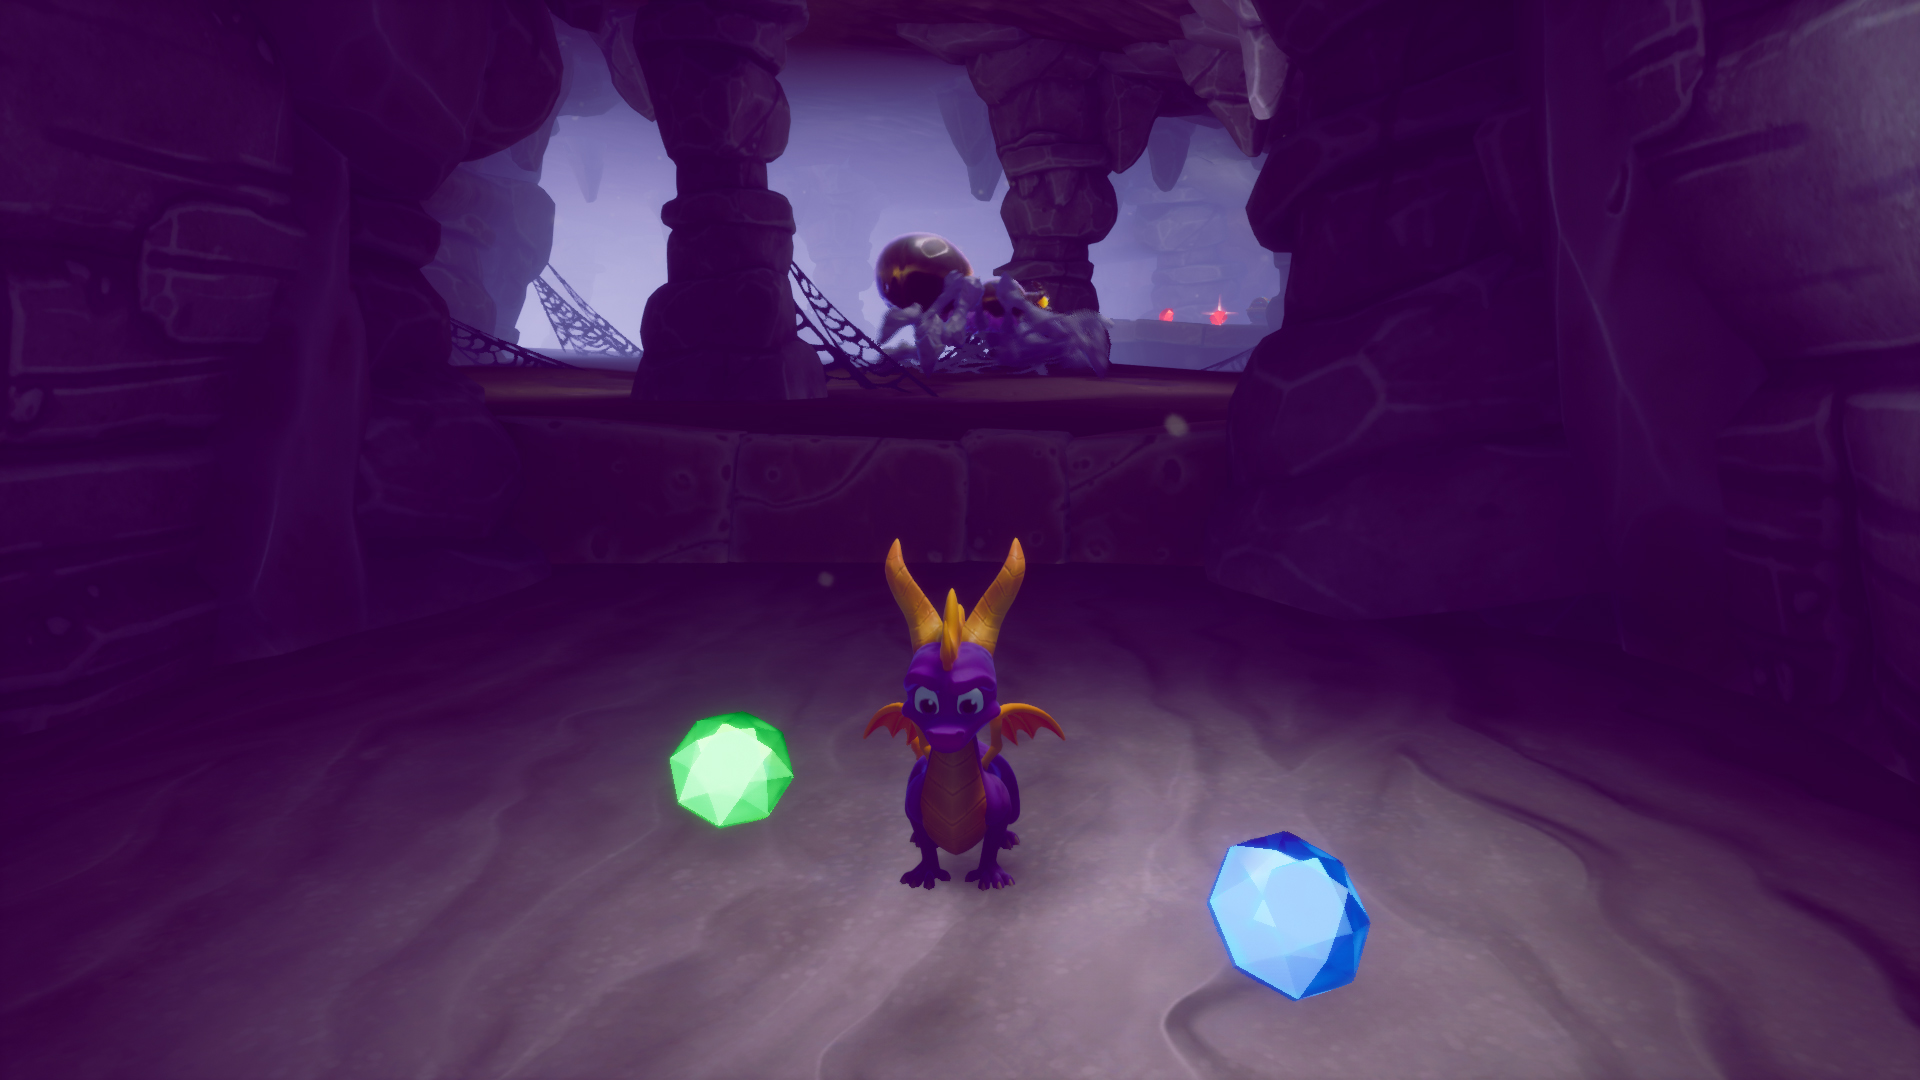
You like rewarding players and giving them sense of satisfaction and progression. As such you shower them in loot. Soon the level you have is packed with lots and lots of rotating in place items. Your FPS is down.
If all of the above is the case, and if indeed your performance is low, then the reason might be exactly in the loot. More specifically, in the way you did the simple animation associated with it.
There are two ways you could approach making this animation. One is through a Blueprint Actor that has moving component that gives the item a rotation on each game tick through the blueprint logic. The second way is through a custom material shader (Material Graph) that rotates the loot through World Position Offset. There is also a third way, through an animation created in Blender or Maya and imported, but we will ignore that because most students and devs will prefer to do something as simple as rotation around pivot inside the engine itself, instead of going outside of it.
For your FPS to be down, you’ve most likely picked the first option. You’ve created your loot as a blueprint that gets placed in a static location in the world. That blueprint then has the logic to rotate the item around, or make it hover up and down. By doing it through the blueprint you’ve inadvertently increased your draw calls by causing each placed instance of the loot to be a unique draw call.
💎💎💎💎💎💎💎💎💎💎💎💎💎
The culprit here:
- To make the item animate through a blueprint, you set the geometry to “Movable”;
- A “Movable” instead of “Static” game object always ends up in its own draw call;
- Introduce hundreds of those. They wont stack into one draw call, they will be hundreds of draw calls.
If instead you animate the object through the Material Graph, using World Position Offset (WPO) then your animation will end up being on the GPU. All objects using the material that animates them could be left to “Static” and still visually animate in movement. All of those objects would then bundle in draw calls.
You would no longer be making hundreds and hundreds of needless draw calls that slow down your CPU.
Your performance will increase. Your FPS will be higher.
💎💎💎💎💎💎💎💎💎💎💎💎💎
This video is the best showcase, and explanation, of everything I wrote above. I found it some time ago randomly and was very impressed by the great presentation in it. Give it a watch to learn more.
The showcase is in UE4 but the inner workings are the same in UE5. As such if you found yourself making rotating loot, all of this info is still valid. It’s also the same way in Unity.
Overlapping Lights
Another aspect that can be incredibly influential over your performance is light. Depending on how you use “Point Lights” and “Spotlights” in your project, you might end up with a lot of overlaps in light that increase the cost of the light actors and drag down your performance.
No matter if we are in UE5, UE4 or Unity, we need to be careful with movable, overlapping lights, and we need to be intelligent with the way we place those actors in the world.
The goal is to always keep overlaps in lights low. Light actors should be placed with sensible attenuation radius and should not be stacked over one another, even when they have small radius.
Lights Example
When we are talking about lighting that is realistic and looks cinematic and moody, the general artistic comment of “less is more” is even stronger than other mediums of art. As such, if we set up lighting in a smart way, we will get a better artistic visual through using less amount of point lights and spotlights. That will then result in better performance too, thanks to the already mentioned reasons.
But lets explore some visual examples of lights overlapping. For that I will take a look at my project ”The Amarantos Ritual" (check the link to read about its making!).
Interactive element below. Move the white bar and arrows in the middle to see comparison between two images.In the comparison images above we first see the final scene. The secondary screenshot overlays on top the billboards of the lights, showcasing their position in the world.
If with the UE5 scene open, we click on the viewport and then we press “ALT + 7” on the keyboard, we will go into “Light Complexity”. That is an “Optimization Viewmode”. In the secondary image below, we can see lots of blue, green and red colors. That’s the light complexity view mode.
Interactive element below. Move the white bar and arrows in the middle to see comparison between two images.The legend of how to read the view mode comes in the form of the long, color gradient bar in the lower parts of the screen. It reads as:
- Deep blues to light blues - little overlaps;
- Green to yellow - medium overlaps;
- Orange to deep red - a lot of overlaps;
- Purple to white - extremely high amount of overlaps.
Or in flashy, absolutely needless, colors that I spend way too long writing code for, given that I will probably never reuse in the future of this blog (I mean, behold how ugly it is!):
1. Deep blues to light blues - little overlaps;
2. Green to yellow - medium overlaps;
3. Orange to deep red - a lot of overlaps;
4. Purple to white - extremely high amount of overlaps.
The bigger amount of lights affecting a surface (overlapping there), the more expensive to render that surface becomes. The colors indicate that:
- Blue - surface only affected by your Directional Light.
- Green - surface affected by your Dir Light + one more light.
- …..
- Red - surface affected by up to 5 different lights.
When we are working on our lighting set up, we want to check this light complexity view mode from time to time. That is in order to track if we get big “offenders” in overlapping lights. If we see any, we want to select the light and under its settings tweak the “Attenuation Radius” down.
In the gif below, we can see me doing exactly that with two point lights:
Note how in the middle of the gif above playing, when spectating the optimization view mode, the colors change from purples and whites to bit more reds. That is the frame where I selected two Point Lights. They had “Attenuation Radius” setting of 300. I toned them down to a radius of 100.
If you observe the change between the final frame and the first one, you see before-and-after. Indeed there is a difference in how the lighting looks. But the lesson here is that there are lots of situation in which you might needlessly have a large amount of attenuation radius. If you go into the setting and dial it down slowly, you might see that the first many numbers you go down through might not change the visual at all. But in the background, it will change the overlap in light and it will optimize your scene further.
Lights Art Control
Lets mention the “less is more” part again though.
I want to point out once more, that when we have less amount of lights in a scene, they are actually artistically easier to direct and control. As such a well lit, moody and beautiful scene, will more often be build up of the elegance of a few large lights, as opposed to a constellation of many tiny lights.
Keep that in mind and study movies and cinematic direction in order to learn how to see the simplicity and elegance of use of light in broad strokes, instead of tiny ones. That will make you better at lighting as art, but it will coincidentally make your scenes more optimized as well.
Reference is queen here so you always want to find good photographs and movie stills to base your lighting work off of.
Baked Lights
In a more old-fashioned lighting set up, where one relies on stationary lights that will be baked, overlapping lights might not be nearly as big of an issue. That set up is commonly seen in UE4 and Unity.
As already explored, in a more modern lighting set up, where nearly all of the lights are movable and will not be baked at all, overlapping lights can have a detrimental affect on your performance. This lighting set up is what we most commonly see in UE5 and Lumen.
Even if you project is in UE5, if you are a student that is looking to expand their knowledge and find their first break into the industry, I would say that its worth looking up how to create good lightmaps for assets. Those lightmaps will then allow you, with the right settings, to bake most of your lights in your scene.
Lots of next gen games that are build in UE5 don’t use baked lights. But lots of games still use baked lights (for example most projects I’ve worked on over at Rebellion). The technique is incredibly good and beneficial, with little drawbacks to the art and big wins in the performance, when done the right way. As such its something commonly found in lots of studios out there and you having some knowledge in it will put you ahead of a lot of other candidates that might compete with you in a job search.
GPU Profiling Tool
You can see how well, or bad, your lights are performing directly into the GPU profiler tool that Unreal provides as well.
This tool is incredibly beneficial as it lists the costs to anything that ends up on the GPU. In the cases where you know that your graphics are dragging you down, and that you might be GPU-bound, you can use that screen to analyze what needs improving.
Just like the time we clicked the Unreal cmd in the lower left corner of the screen to type “stat scenerendering” we can now use it to instead call this GPU tool.
Click the cmd and type “Profile GPU”.
|
|
Then hit “Enter” on the keyboard. The profiler window will open.
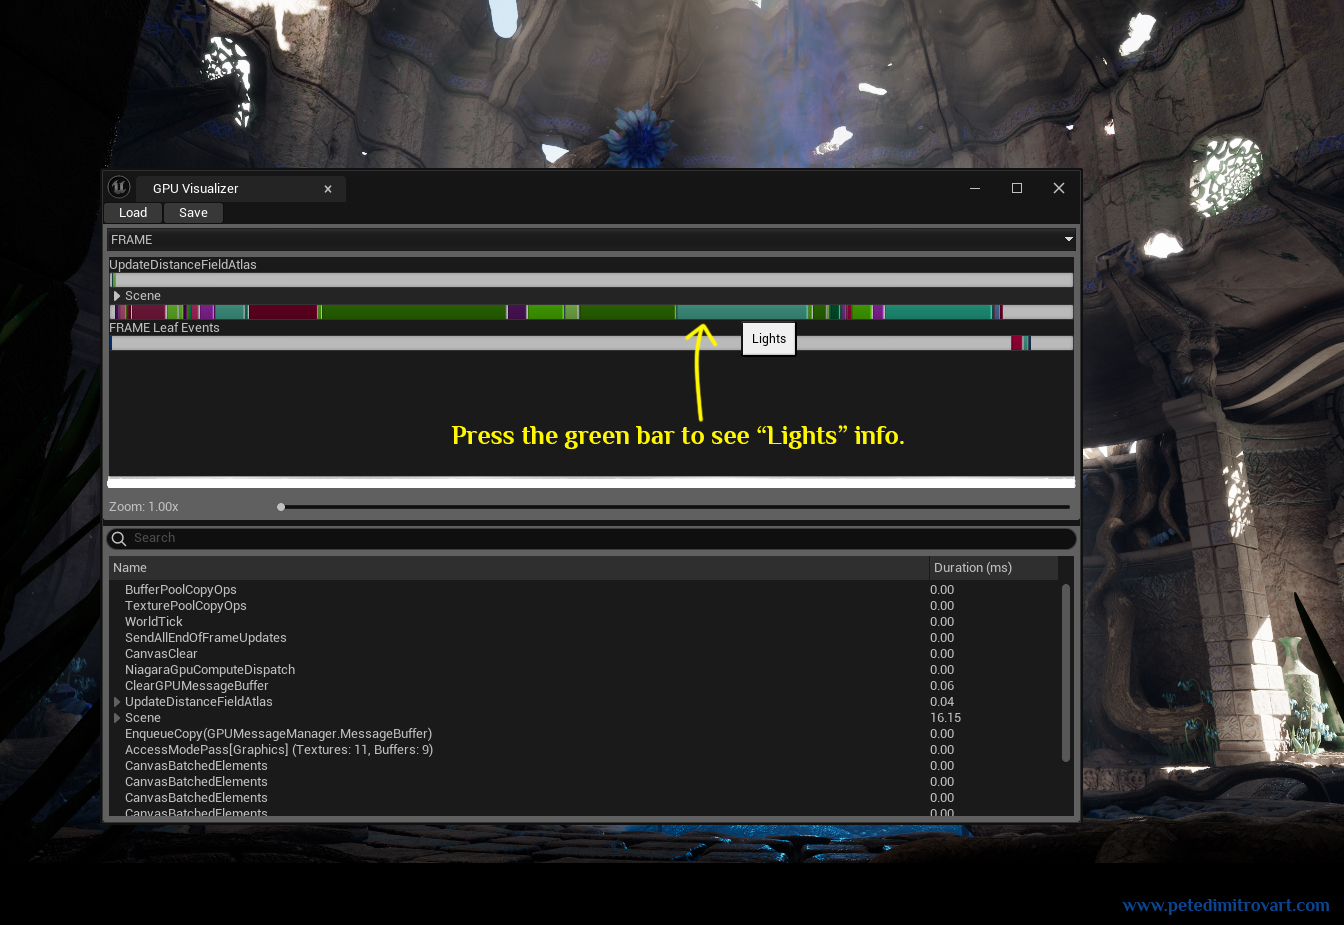
In the first image above, we can see that there is a long bar colored in different regions. Each of those represents a different cost that is on the GPU. Hovering over the teal-green colored section in my case, I saw that its listed as “Lights”.
I clicked on that and it expanded into the image below:
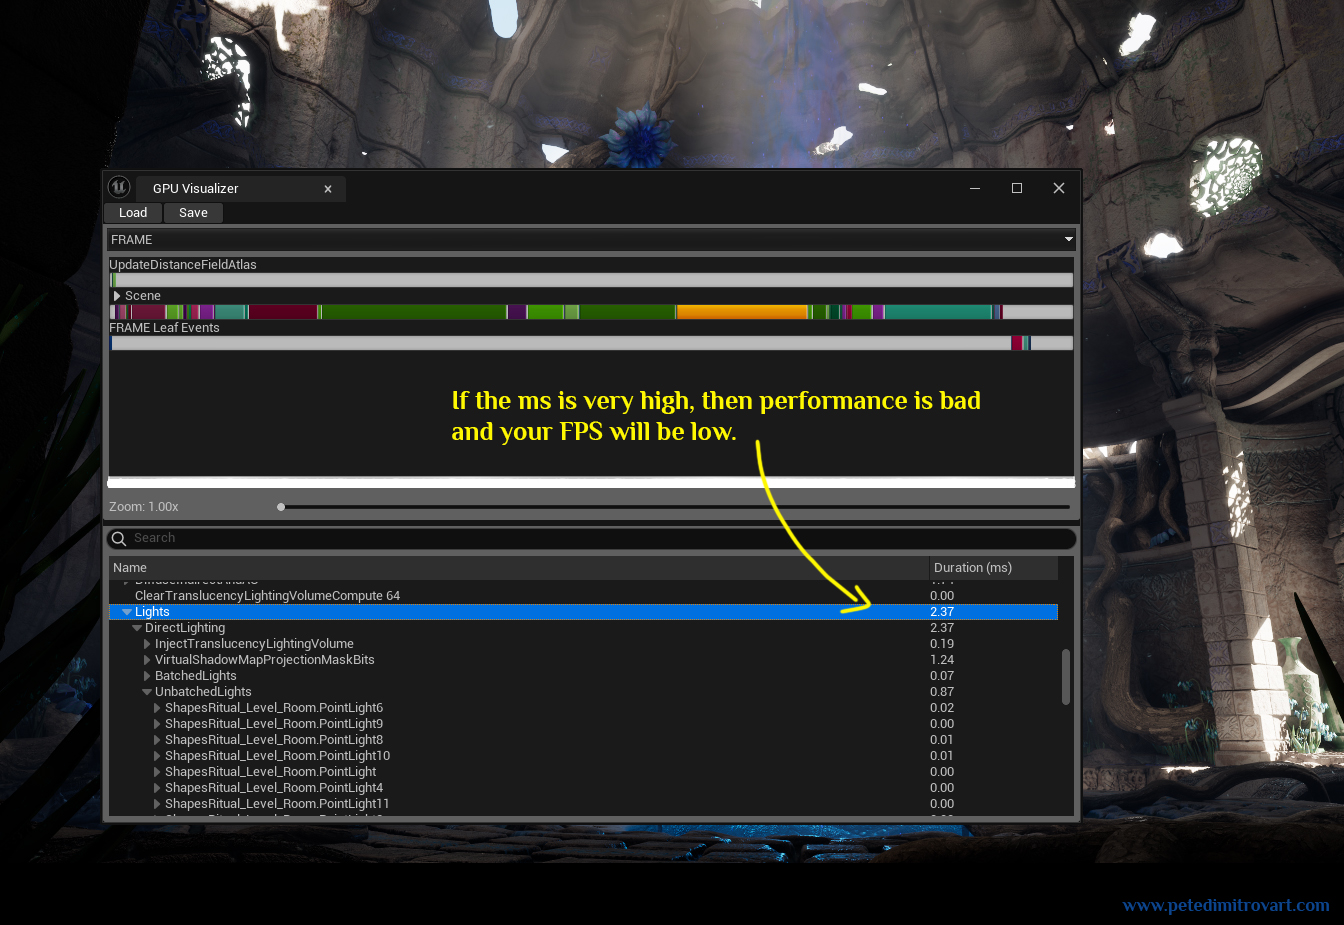
After selecting to take a closer look at the lights, we can see them listed in the category below. If the ms listed in this category is very high, then the performance is bad and your FPS will be low.
Apart from the lights, this tool allows you to nicely observe if there are other performance issues as well.
An example from an old project of mine is one time when I was having incredibly poor FPS. I ran the GPU Profiler Viz and I could see that the “Hair Groom” actors associated with my Metahuman in the scene was giving incredibly hard time to my GTX 1070. I disabled the hair, put a helmet on the metahuman, and started saving up for a newer gen GPU that could handle it.
Conclusion

In this lengthy blog post, we explore common reasons for low performance in projects. That is in both environment art projects and level design blockouts.
We looked at some ideas of how to handle and fix the issues. We explored draw calls, static meshes and BSP brushes. We looked at how to convert BSP brushes into static meshes that are more manageable in draw calls.
Next we looked at blueprints actors and how faulty default settings might cause high draw calls. From there we went into animating simple drop. Finally we explored lights and what overlapping lights are.
The tooling that we explored, like the “scenerendering” and “GPU profiler” are incredibly powerful. I mentioned some ways to look at those and analyze your work. The screens list lots and lots more useful data though. It’s data that is too much to explore in a single blog post. As such I shall leave you to analyze and perfect your performance further by looking at all of that.
One final thing that I would like to mention, that we didn’t get the time to cover in this post either, is that what we do in blueprints when it comes to scripting and to logic behind implementing gameplay, can of course, also affect performance.
As such make sure you not only spend your energy profiling your graphics, but try to optimize and make sure the logic of your blueprints, code and gameplay is also well created.
If you enjoyed this blog post, consider subscribing in the form below. That way you will get a notification the next time I publish a new blog.
Have fun creating your art and level designs,
Pete.